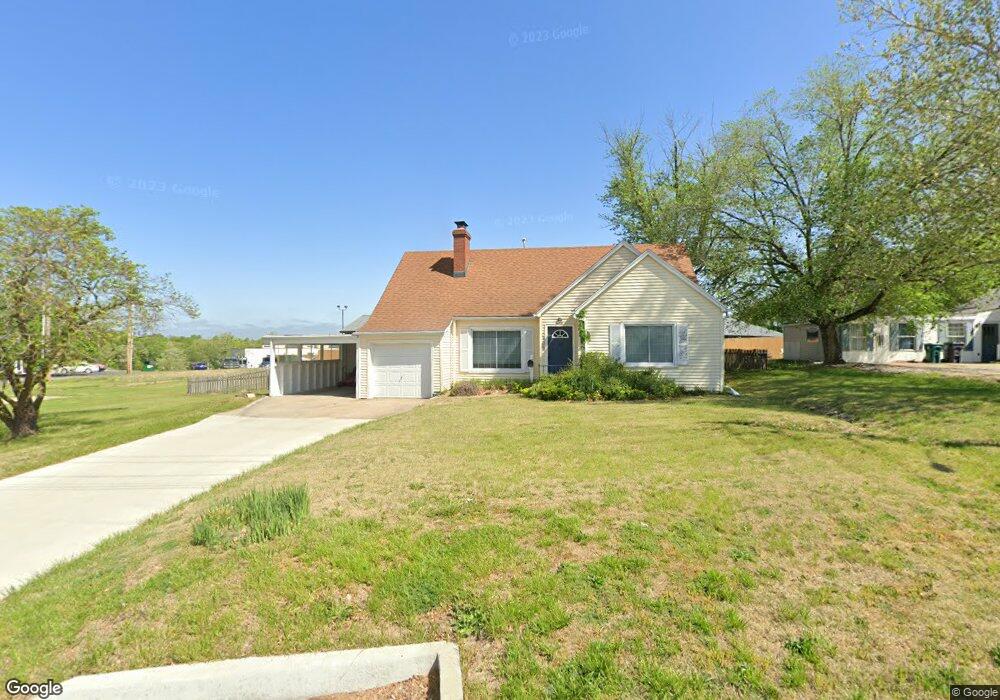
1203 Fisk Ave Moberly, MO 65270
Estimated Value: $171,000 - $227,000
4
Beds
2
Baths
1,780
Sq Ft
$114/Sq Ft
Est. Value
About This Home
This home is located at 1203 Fisk Ave, Moberly, MO 65270 and is currently estimated at $202,486, approximately $113 per square foot. 1203 Fisk Ave is a home located in Randolph County with nearby schools including Moberly Senior High School, St. Pius X. Catholic School, and Maranatha Seventh-day Adventist School.
Ownership History
Date
Name
Owned For
Owner Type
Purchase Details
Closed on
Jan 13, 2011
Sold by
Banjak John T
Bought by
Derr James W and Derr Donna M
Current Estimated Value
Purchase Details
Closed on
Aug 25, 2006
Sold by
Powell Janet Y
Bought by
Wilkerson Gabriel D and Wilkerson Kelly M
Home Financials for this Owner
Home Financials are based on the most recent Mortgage that was taken out on this home.
Original Mortgage
$80,000
Interest Rate
6.72%
Create a Home Valuation Report for This Property
The Home Valuation Report is an in-depth analysis detailing your home's value as well as a comparison with similar homes in the area
Home Values in the Area
Average Home Value in this Area
Purchase History
| Date | Buyer | Sale Price | Title Company |
|---|---|---|---|
| Derr James W | -- | -- | |
| Wilkerson Gabriel D | -- | -- |
Source: Public Records
Mortgage History
| Date | Status | Borrower | Loan Amount |
|---|---|---|---|
| Previous Owner | Wilkerson Gabriel D | $80,000 |
Source: Public Records
Tax History Compared to Growth
Tax History
| Year | Tax Paid | Tax Assessment Tax Assessment Total Assessment is a certain percentage of the fair market value that is determined by local assessors to be the total taxable value of land and additions on the property. | Land | Improvement |
|---|---|---|---|---|
| 2025 | $1,657 | $24,690 | $2,731 | $21,959 |
| 2024 | $1,657 | $22,760 | $2,375 | $20,385 |
| 2023 | $1,683 | $22,760 | $2,375 | $20,385 |
| 2022 | $1,620 | $22,500 | $2,375 | $20,125 |
| 2021 | $1,619 | $22,500 | $2,375 | $20,125 |
| 2020 | $1,619 | $22,500 | $2,375 | $20,125 |
| 2019 | $1,616 | $22,500 | $2,375 | $20,125 |
| 2018 | $865 | $12,090 | $2,375 | $9,715 |
| 2017 | $864 | $12,090 | $0 | $0 |
| 2016 | $956 | $13,450 | $0 | $0 |
| 2014 | -- | $12,600 | $0 | $0 |
| 2013 | -- | $12,600 | $0 | $0 |
| 2012 | -- | $12,660 | $0 | $0 |
Source: Public Records
Map
Nearby Homes
- 1126 Fisk Ave
- 4 Fair Oaks
- 816 W Reed St
- 808 W Reed St
- 817 Gilman St
- 1201 Bond St
- 710 W Rollins St
- 632 W Logan St
- 1123 Concannon St
- 1029 Concannon St
- 1524 Myra St
- 407 Epperson St
- 800 Franklin St
- LOT 2 County Rd
- 1377 Conestoga Trail
- 515 Greenbrier Rd
- 1541 Myra St
- 1 Stone Ave
- 1224 &1226 Henry St
- 1412 Buchanan St