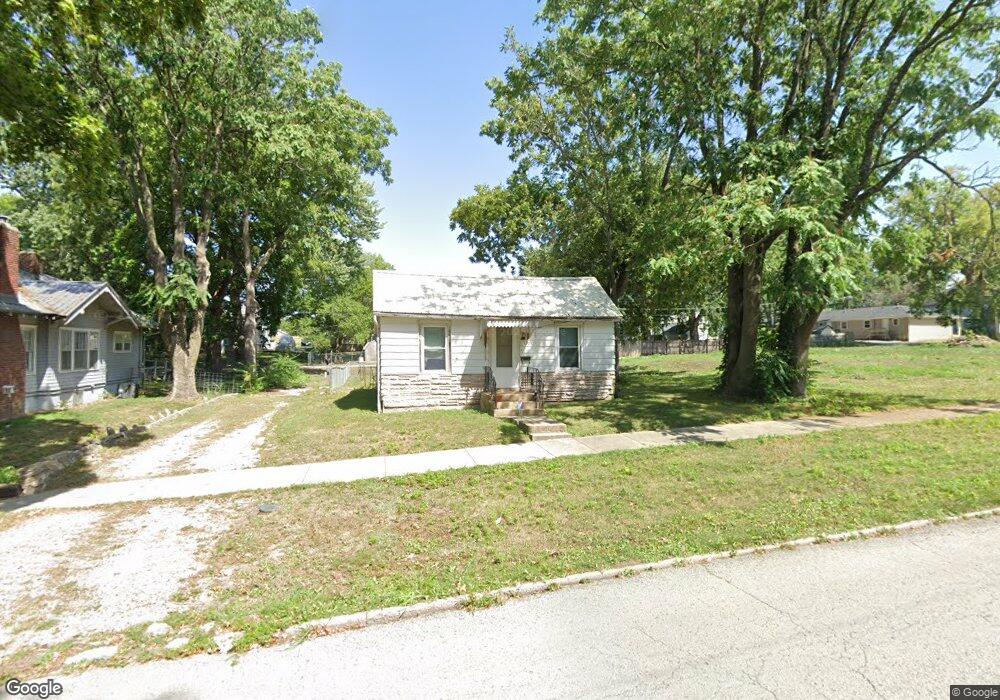
1203 Locust St Chillicothe, MO 64601
Estimated Value: $63,377 - $104,000
2
Beds
1
Bath
660
Sq Ft
$126/Sq Ft
Est. Value
About This Home
This home is located at 1203 Locust St, Chillicothe, MO 64601 and is currently estimated at $83,459, approximately $126 per square foot. 1203 Locust St is a home located in Livingston County with nearby schools including Chillicothe Elementary School, Field Elementary School, and Dewey Elementary School.
Ownership History
Date
Name
Owned For
Owner Type
Purchase Details
Closed on
Apr 5, 2022
Sold by
Equity Trust Company
Bought by
Myers Joshua M and Myers Haley N
Current Estimated Value
Purchase Details
Closed on
Sep 12, 2008
Sold by
Cox Joseph J and Cox Terria J
Bought by
Equity Trust Co and Kerri Anderson Ira
Home Financials for this Owner
Home Financials are based on the most recent Mortgage that was taken out on this home.
Original Mortgage
$25,000
Interest Rate
6.54%
Mortgage Type
Purchase Money Mortgage
Create a Home Valuation Report for This Property
The Home Valuation Report is an in-depth analysis detailing your home's value as well as a comparison with similar homes in the area
Home Values in the Area
Average Home Value in this Area
Purchase History
| Date | Buyer | Sale Price | Title Company |
|---|---|---|---|
| Myers Joshua M | -- | None Listed On Document | |
| Equity Trust Co | -- | Livingston County Title Comp |
Source: Public Records
Mortgage History
| Date | Status | Borrower | Loan Amount |
|---|---|---|---|
| Previous Owner | Equity Trust Co | $25,000 |
Source: Public Records
Tax History
| Year | Tax Paid | Tax Assessment Tax Assessment Total Assessment is a certain percentage of the fair market value that is determined by local assessors to be the total taxable value of land and additions on the property. | Land | Improvement |
|---|---|---|---|---|
| 2025 | $232 | $3,260 | $1,030 | $2,230 |
| 2024 | $232 | $3,230 | $1,030 | $2,200 |
| 2023 | $235 | $3,230 | $1,030 | $2,200 |
| 2022 | $226 | $3,140 | $1,030 | $2,110 |
| 2020 | $226 | $3,110 | $1,030 | $2,080 |
| 2019 | $226 | $3,110 | $1,030 | $2,080 |
| 2018 | $228 | $3,160 | $1,030 | $2,130 |
| 2017 | $228 | $3,160 | $1,030 | $2,130 |
| 2016 | -- | $3,050 | $920 | $2,130 |
| 2015 | -- | $3,050 | $920 | $2,130 |
| 2011 | -- | $16,070 | $4,860 | $11,210 |
Source: Public Records
Map
Nearby Homes