1203 Loowit Falls Ct Unit 3 Braselton, GA 30517
Estimated Value: $463,745 - $489,000
--
Bed
4
Baths
3,433
Sq Ft
$140/Sq Ft
Est. Value
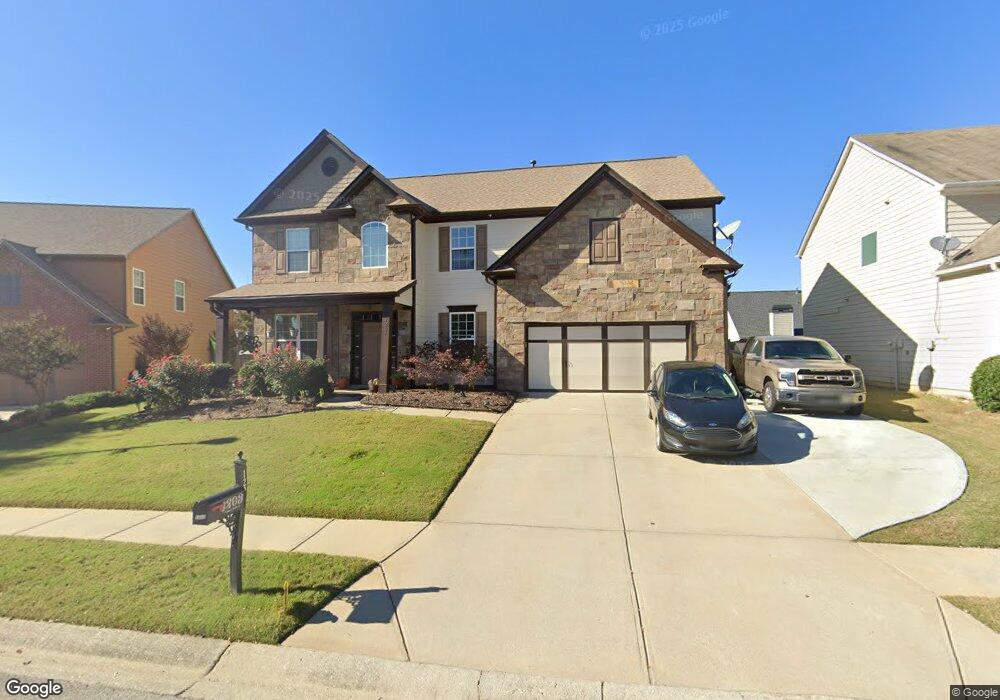
About This Home
This home is located at 1203 Loowit Falls Ct Unit 3, Braselton, GA 30517 and is currently estimated at $481,186, approximately $140 per square foot. 1203 Loowit Falls Ct Unit 3 is a home located in Barrow County with nearby schools including Bramlett Elementary School, Russell Middle School, and Winder-Barrow High School.
Ownership History
Date
Name
Owned For
Owner Type
Purchase Details
Closed on
Sep 28, 2017
Sold by
Thomas Patricia Ann
Bought by
Thomas Zach
Current Estimated Value
Purchase Details
Closed on
Nov 30, 2007
Sold by
Zach Thomas
Bought by
Thomas Zach and Thomas Patricia A
Home Financials for this Owner
Home Financials are based on the most recent Mortgage that was taken out on this home.
Original Mortgage
$256,683
Interest Rate
6.22%
Mortgage Type
FHA
Purchase Details
Closed on
Aug 14, 2007
Sold by
Dg Jenkins Development Inc
Bought by
Winmark Homes Inc
Purchase Details
Closed on
Nov 12, 2002
Bought by
Dg Jenkins Development Inc
Create a Home Valuation Report for This Property
The Home Valuation Report is an in-depth analysis detailing your home's value as well as a comparison with similar homes in the area
Home Values in the Area
Average Home Value in this Area
Purchase History
| Date | Buyer | Sale Price | Title Company |
|---|---|---|---|
| Thomas Zach | -- | -- | |
| Thomas Zach | -- | -- | |
| Thomas Zack | $260,000 | -- | |
| Winmark Homes Inc | $66,000 | -- | |
| Dg Jenkins Development Inc | -- | -- |
Source: Public Records
Mortgage History
| Date | Status | Borrower | Loan Amount |
|---|---|---|---|
| Previous Owner | Thomas Zack | $256,683 |
Source: Public Records
Tax History Compared to Growth
Tax History
| Year | Tax Paid | Tax Assessment Tax Assessment Total Assessment is a certain percentage of the fair market value that is determined by local assessors to be the total taxable value of land and additions on the property. | Land | Improvement |
|---|---|---|---|---|
| 2024 | $4,471 | $173,510 | $36,000 | $137,510 |
| 2023 | $4,456 | $173,510 | $36,000 | $137,510 |
| 2022 | $3,996 | $135,126 | $29,200 | $105,926 |
| 2021 | $3,729 | $117,727 | $24,000 | $93,727 |
| 2020 | $3,495 | $109,661 | $20,000 | $89,661 |
| 2019 | $3,416 | $105,594 | $20,000 | $85,594 |
| 2018 | $3,265 | $101,200 | $20,000 | $81,200 |
| 2017 | $2,588 | $88,869 | $20,000 | $68,869 |
| 2016 | $2,710 | $83,849 | $20,000 | $63,849 |
| 2015 | $2,736 | $84,534 | $20,000 | $64,534 |
| 2014 | $2,299 | $73,335 | $11,368 | $61,967 |
| 2013 | -- | $68,729 | $11,368 | $57,361 |
Source: Public Records
Map
Nearby Homes
- 1602 Sahale Falls Dr
- 1208 Loowit Falls Ct
- 2545 Olney Falls Dr
- 6356 Mossy Oak Landing
- 2560 Olney Falls Dr
- 2655 Old Winder Hwy
- 2651 Bald Cypress Dr
- 747 Sienna Valley Dr
- 7062 Grand Hickory Dr
- 2721 Bald Cypress Dr
- 2445 Retreat Point Pkwy
- 6905 White Walnut Way
- 6834 White Walnut Way
- 6895 White Walnut Way
- 914 Rainsong Ct
- 908 Rainsong Ct
- 9036 Lexington Ct
- 1201 Loowit Falls Ct
- 1205 Loowit Falls Ct
- 1205 Loowit Falls Ct Unit 3
- 1302 Loowit Falls Way
- 1302 Loowit Falls Way
- 1302 Loowit Falls Way
- 0 Loowit Falls Ct Unit 8698224
- 0 Loowit Falls Ct Unit 8254829
- 0 Loowit Falls Ct
- 2307 Loowit Falls Dr
- 2307 Loowit Falls Dr
- 1304 Loowit Falls Way
- 1200 Loowit Falls Ct
- 1204 Loowit Falls Ct
- 1204 Loowit Falls Ct Unit 3
- 0 Loowit Falls Dr Unit 7534334
- 0 Loowit Falls Dr Unit 8172816
- 0 Loowit Falls Dr Unit 8169153
- 0 Loowit Falls Dr Unit 7549592
- 0 Loowit Falls Dr Unit 8135573