
Seller's Agent in 2025
Penny Gable
TurnKey Realty LLC
(641) 236-8655
59 in this area
81 Total Sales
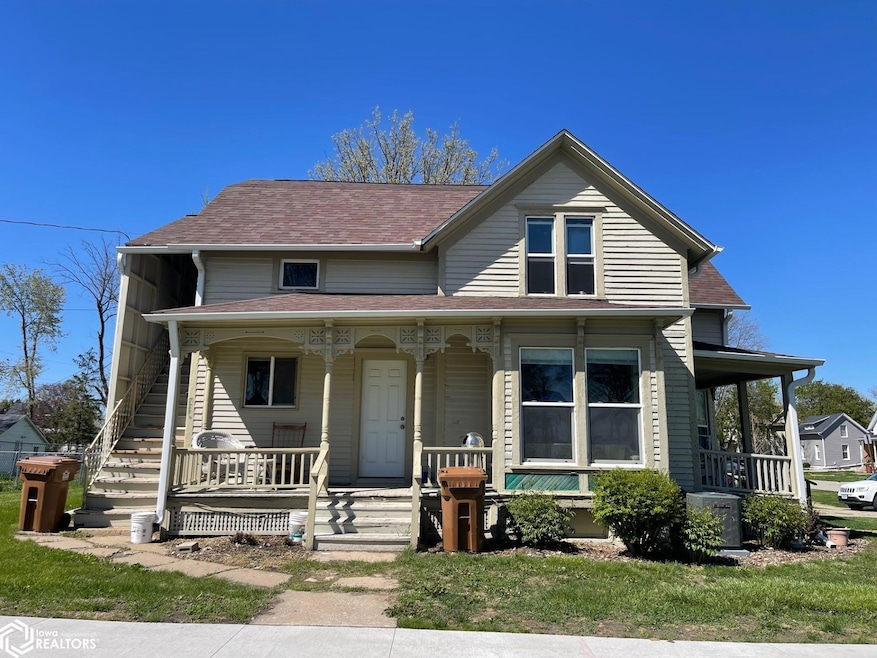
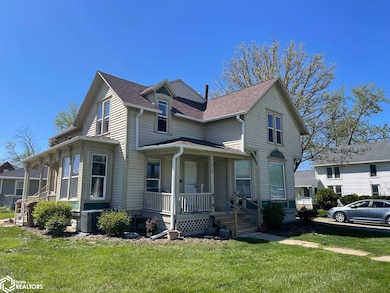
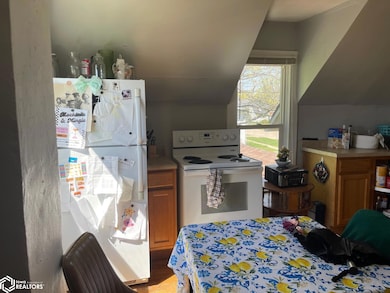
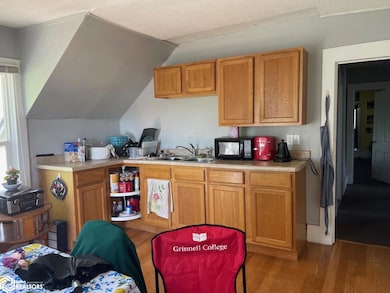

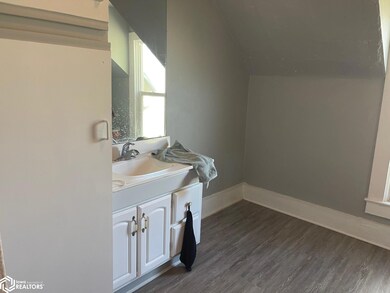
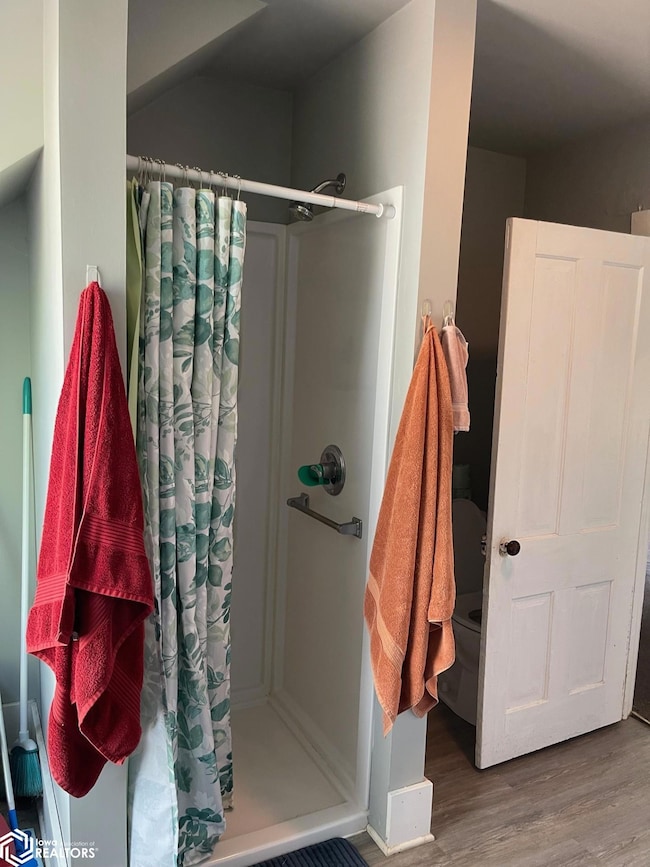
Excellent Investment Property. Are you thinking about getting into the world of rentals? Look no further this is the perfect starter property. The main floor is a 3 bedroom unit with a full bathroom, eat-in kitchen and living room.($1350.00 a month) The upstairs can either be a 2 bedroom, kitchen, living room and 3/4 bath or a 3 bedroom, kitchen and 3/4 bath.($950.00 a month) There is also a 2 car attached garage that is owner used. This property is being SOLD AS IS. Please reach out for more financials. Call your local realtor today for a personal tour.
| Date | Type | Sale Price | Title Company |
|---|---|---|---|
| Warranty Deed | $165,000 | None Listed On Document | |
| Warranty Deed | $245,000 | Laughlin Law Firm Plc | |
| Quit Claim Deed | $200,000 | None Listed On Document | |
| Sheriffs Deed | $60,927 | None Listed On Document | |
| Warranty Deed | $5,000 | None Available | |
| Warranty Deed | $36,000 | None Available | |
| Deed | $1,140,000 | None Available | |
| Warranty Deed | $87,000 | None Available | |
| Warranty Deed | $770,000 | None Available | |
| Interfamily Deed Transfer | -- | None Available | |
| Warranty Deed | $45,000 | None Available | |
| Joint Tenancy Deed | -- | None Available | |
| Warranty Deed | $149,000 | None Available |
| Date | Event | Price | List to Sale | Price per Sq Ft |
|---|---|---|---|---|
| 09/19/2025 09/19/25 | Sold | $165,000 | -17.1% | $86 / Sq Ft |
| 08/11/2025 08/11/25 | Pending | -- | -- | -- |
| 05/23/2025 05/23/25 | For Sale | $199,000 | -- | $104 / Sq Ft |
| Year | Tax Paid | Tax Assessment Tax Assessment Total Assessment is a certain percentage of the fair market value that is determined by local assessors to be the total taxable value of land and additions on the property. | Land | Improvement |
|---|---|---|---|---|
| 2025 | $2,408 | $150,050 | $23,100 | $126,950 |
| 2024 | $2,384 | $144,760 | $25,990 | $118,770 |
| 2023 | $1,962 | $144,760 | $25,990 | $118,770 |
| 2022 | $1,944 | $103,760 | $21,420 | $82,340 |
| 2021 | $1,944 | $97,890 | $20,210 | $77,680 |
| 2020 | $1,590 | $81,750 | $20,210 | $61,540 |
| 2019 | $1,614 | $81,750 | $20,210 | $61,540 |
| 2018 | $1,586 | $81,750 | $20,210 | $61,540 |
| 2017 | $1,620 | $81,750 | $20,210 | $61,540 |
| 2016 | $1,620 | $81,750 | $20,210 | $61,540 |
| 2015 | -- | $82,000 | $19,550 | $62,450 |
| 2014 | -- | $82,000 | $19,550 | $62,450 |
Seller's Agent in 2025
Penny Gable
TurnKey Realty LLC
(641) 236-8655
59 in this area
81 Total Sales
Source: NoCoast MLS
MLS Number: NOC6327926
APN: 180-0472900
Disclaimer: Certain information contained herein is derived from information provided by parties other than Homes.com. All information provided is deemed reliable, but is not guaranteed to be accurate and should be independently verified.
![]() IDX information is provided exclusively for personal, non-commercial use, and may not be used for any purpose other than to identify prospective properties consumers may be interested in purchasing.
IDX information is provided exclusively for personal, non-commercial use, and may not be used for any purpose other than to identify prospective properties consumers may be interested in purchasing.
Information is deemed reliable but not guaranteed.