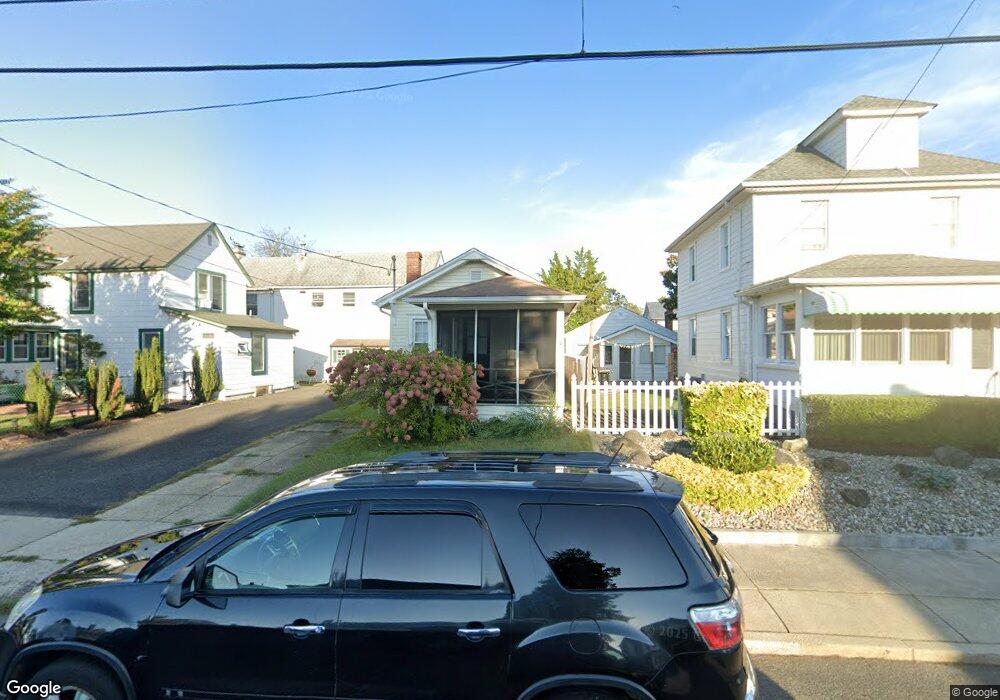
1203 Maplewood Rd Belmar, NJ 07719
Estimated Value: $465,364 - $634,000
4
Beds
1
Bath
816
Sq Ft
$693/Sq Ft
Est. Value
About This Home
This home is located at 1203 Maplewood Rd, Belmar, NJ 07719 and is currently estimated at $565,341, approximately $692 per square foot. 1203 Maplewood Rd is a home located in Monmouth County with nearby schools including Belmar Elementary School, St. Rose Grammar School, and St Rose High School.
Ownership History
Date
Name
Owned For
Owner Type
Purchase Details
Closed on
May 14, 2024
Sold by
Pidgeon Larkin Denise
Bought by
Larkin Denise Pidgeon and Larkin Matthew W
Current Estimated Value
Purchase Details
Closed on
May 30, 2014
Sold by
Pidgeon John C
Bought by
Pidgeon John C and Larkin Denise Pidgeon
Create a Home Valuation Report for This Property
The Home Valuation Report is an in-depth analysis detailing your home's value as well as a comparison with similar homes in the area
Home Values in the Area
Average Home Value in this Area
Purchase History
| Date | Buyer | Sale Price | Title Company |
|---|---|---|---|
| Larkin Denise Pidgeon | -- | Real Property Title | |
| Larkin Denise Pidgeon | -- | Real Property Title | |
| Pidgeon John C | -- | None Available |
Source: Public Records
Tax History Compared to Growth
Tax History
| Year | Tax Paid | Tax Assessment Tax Assessment Total Assessment is a certain percentage of the fair market value that is determined by local assessors to be the total taxable value of land and additions on the property. | Land | Improvement |
|---|---|---|---|---|
| 2025 | $2,257 | $155,100 | $133,200 | $21,900 |
| 2024 | $2,181 | $155,100 | $133,200 | $21,900 |
| 2023 | $2,181 | $155,100 | $133,200 | $21,900 |
| 2022 | $2,105 | $155,100 | $133,200 | $21,900 |
| 2021 | $2,105 | $155,100 | $133,200 | $21,900 |
| 2020 | $2,086 | $155,100 | $133,200 | $21,900 |
| 2019 | $2,086 | $155,100 | $133,200 | $21,900 |
| 2018 | $1,915 | $155,100 | $133,200 | $21,900 |
| 2017 | $1,869 | $155,100 | $133,200 | $21,900 |
| 2016 | $1,880 | $98,400 | $54,000 | $44,400 |
| 2015 | $1,696 | $88,400 | $44,000 | $44,400 |
| 2014 | $2,098 | $108,400 | $64,000 | $44,400 |
Source: Public Records
Map
Nearby Homes
- 1208 Pine Tree Way
- 1223 Briarwood Rd
- 1208 L St
- 1204 River Rd
- 1630 Oakwood Rd
- 1644 Riverview Terrace
- 923 Woodland Ave
- 823 13th Ave
- 1024 17th Ave
- 1000 River Rd Unit 4G
- 1014 Glenn St
- 704 15th Ave
- 371 Sea Spray Ct
- 1704 Grove St
- 609 11th Ave
- 708 18th Ave
- 303 Spinnaker Way
- 615 17th Ave
- 1609 Wight St
- 1813 Margerum Ave
- 1205 Maplewood Rd
- 1507 River Rd Unit 9
- 1207 Maplewood Rd
- 1505 River Rd
- 1209 Maplewood Rd
- 1213 Maplewood Rd
- 1503 River Rd
- 1206 Maplewood Rd
- 1208 Maplewood Rd
- 1204 Pine Tree Way
- 1215 Maplewood Rd
- 1210 Maplewood Rd
- 1603 River Rd
- 1501 River Rd
- 1214 Maplewood Rd
- 1217 Maplewood Rd
- 1216 Maplewood Rd
- 1605 River Rd
- 1212 Pine Tree Way
- 1219 Maplewood Rd