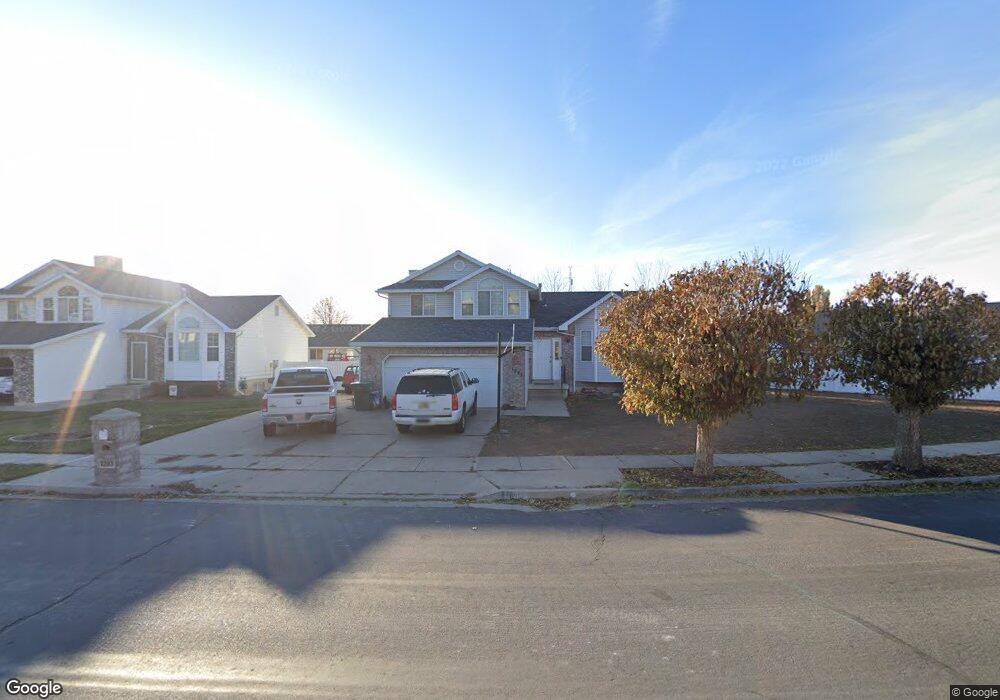
1203 N 2875 W Layton, UT 84041
Estimated Value: $492,703 - $529,000
4
Beds
3
Baths
2,262
Sq Ft
$226/Sq Ft
Est. Value
About This Home
This home is located at 1203 N 2875 W, Layton, UT 84041 and is currently estimated at $510,926, approximately $225 per square foot. 1203 N 2875 W is a home located in Davis County with nearby schools including Legacy Junior High School, Layton High School, and North Davis Preparatory Academy.
Ownership History
Date
Name
Owned For
Owner Type
Purchase Details
Closed on
Feb 25, 2015
Sold by
Apple Jonathan A
Bought by
American Homes 4 Rent Properties Nine Ll
Current Estimated Value
Purchase Details
Closed on
Mar 13, 2006
Sold by
Ross Alan A and Ross Breanna
Bought by
Apple Jonathan A
Home Financials for this Owner
Home Financials are based on the most recent Mortgage that was taken out on this home.
Original Mortgage
$187,950
Interest Rate
6.08%
Mortgage Type
VA
Purchase Details
Closed on
Mar 19, 2004
Sold by
Ross Cindy R and George Cindy R
Bought by
Ross Alan A and Ross Breanna
Home Financials for this Owner
Home Financials are based on the most recent Mortgage that was taken out on this home.
Original Mortgage
$134,589
Interest Rate
5.69%
Mortgage Type
FHA
Purchase Details
Closed on
Oct 1, 2002
Sold by
Rhoades Rickie A and Ross Cindy R
Bought by
Ross Cindy R
Create a Home Valuation Report for This Property
The Home Valuation Report is an in-depth analysis detailing your home's value as well as a comparison with similar homes in the area
Home Values in the Area
Average Home Value in this Area
Purchase History
| Date | Buyer | Sale Price | Title Company |
|---|---|---|---|
| American Homes 4 Rent Properties Nine Ll | -- | Inwest Title Services Inc | |
| Apple Jonathan A | -- | Inwest Title Services Inc | |
| Ross Alan A | -- | Bonneville Title Company Inc | |
| Ross Cindy R | -- | -- |
Source: Public Records
Mortgage History
| Date | Status | Borrower | Loan Amount |
|---|---|---|---|
| Previous Owner | Apple Jonathan A | $187,950 | |
| Previous Owner | Ross Alan A | $134,589 |
Source: Public Records
Tax History
| Year | Tax Paid | Tax Assessment Tax Assessment Total Assessment is a certain percentage of the fair market value that is determined by local assessors to be the total taxable value of land and additions on the property. | Land | Improvement |
|---|---|---|---|---|
| 2025 | $2,473 | $259,600 | $111,328 | $148,272 |
| 2024 | $2,393 | $252,999 | $123,062 | $129,937 |
| 2023 | $2,264 | $232,100 | $67,070 | $165,029 |
| 2022 | $2,472 | $455,000 | $138,445 | $316,555 |
| 2021 | $2,266 | $342,000 | $114,242 | $227,758 |
| 2020 | $2,023 | $293,000 | $96,120 | $196,880 |
| 2019 | $1,960 | $278,000 | $98,742 | $179,258 |
| 2018 | $1,784 | $254,000 | $86,591 | $167,409 |
| 2016 | $1,523 | $111,870 | $33,958 | $77,912 |
| 2015 | $1,483 | $103,400 | $33,958 | $69,442 |
| 2014 | $1,537 | $109,609 | $33,958 | $75,651 |
| 2013 | -- | $102,345 | $28,952 | $73,393 |
Source: Public Records
Map
Nearby Homes
- 1250 N 2925 W
- 195 E 2325 S
- 2480 S Main St
- 308 E 1925 S
- 818 N 2625 W
- 668 E 2000 S
- 2181 Katies Way
- 1477 N 2375 W
- 1141 N 2275 W
- 1877 S 725 E
- 460 E 1700 S Unit 1 & 2
- 1818 S 200 W
- 1430 N 2100 W
- 841 N 2175 W
- 867 N 2125 W
- 1491 N 1875 W
- 1491 N 1875 W Unit 158
- 1487 N 1875 W
- 1487 N 1875 W Unit 159
- 1483 N 1875 W
Your Personal Tour Guide
Ask me questions while you tour the home.