Estimated Value: $398,000 - $426,252
3
Beds
2
Baths
2,252
Sq Ft
$184/Sq Ft
Est. Value
About This Home
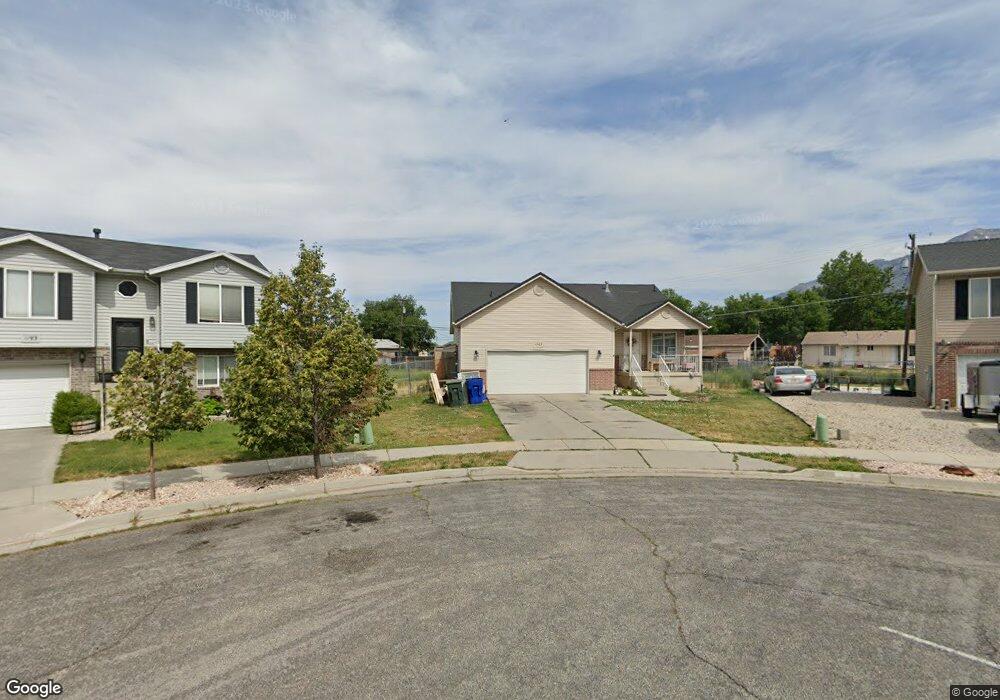
This home is located at 1203 N 475 E, Ogden, UT 84404 and is currently estimated at $413,813, approximately $183 per square foot. 1203 N 475 E is a home located in Weber County with nearby schools including Lincoln School, Highland Junior High School, and Ben Lomond High School.
Ownership History
Date
Name
Owned For
Owner Type
Purchase Details
Closed on
Oct 23, 2008
Sold by
The New Platinum Group Llc
Bought by
Stevenson Management Llc
Current Estimated Value
Purchase Details
Closed on
Dec 9, 2003
Sold by
Cherry Brett N and Stevenson Eric C
Bought by
The New Platinum Group Llc
Home Financials for this Owner
Home Financials are based on the most recent Mortgage that was taken out on this home.
Original Mortgage
$126,000
Interest Rate
5.92%
Mortgage Type
New Conventional
Purchase Details
Closed on
Sep 30, 2002
Sold by
Washington Place Llc
Bought by
Cherry Brett N
Home Financials for this Owner
Home Financials are based on the most recent Mortgage that was taken out on this home.
Original Mortgage
$107,042
Interest Rate
6.22%
Create a Home Valuation Report for This Property
The Home Valuation Report is an in-depth analysis detailing your home's value as well as a comparison with similar homes in the area
Home Values in the Area
Average Home Value in this Area
Purchase History
| Date | Buyer | Sale Price | Title Company |
|---|---|---|---|
| Stevenson Management Llc | -- | Accommodation | |
| The New Platinum Group Llc | -- | Mountain View Title | |
| Cherry Brett N | -- | Mountain View Title | |
| Cherry Brett N | -- | Mountain View Title |
Source: Public Records
Mortgage History
| Date | Status | Borrower | Loan Amount |
|---|---|---|---|
| Previous Owner | Cherry Brett N | $126,000 | |
| Previous Owner | Cherry Brett N | $107,042 |
Source: Public Records
Tax History
| Year | Tax Paid | Tax Assessment Tax Assessment Total Assessment is a certain percentage of the fair market value that is determined by local assessors to be the total taxable value of land and additions on the property. | Land | Improvement |
|---|---|---|---|---|
| 2025 | $2,980 | $435,636 | $150,409 | $285,227 |
| 2024 | $2,968 | $426,000 | $150,418 | $275,582 |
| 2023 | $2,852 | $412,000 | $121,573 | $290,427 |
| 2022 | $2,803 | $406,000 | $101,423 | $304,577 |
| 2021 | $2,293 | $303,000 | $76,076 | $226,924 |
| 2020 | $2,179 | $266,000 | $59,124 | $206,876 |
| 2019 | $2,182 | $250,000 | $48,941 | $201,059 |
| 2018 | $1,959 | $223,000 | $48,941 | $174,059 |
| 2017 | $1,740 | $185,000 | $40,395 | $144,605 |
| 2016 | $1,535 | $88,190 | $17,909 | $70,281 |
| 2015 | $1,429 | $80,090 | $17,909 | $62,181 |
| 2014 | $1,308 | $71,987 | $16,111 | $55,876 |
Source: Public Records
Map
Nearby Homes
- 298 E 1275 S Unit 108
- 312 E 1275 S Unit 112
- 1261 N 300 E Unit 182
- 1255 N 300 E Unit 183
- 1267 N 300 E Unit 181
- 1249 N 300 E Unit 184
- 602 Ridge Place Dr
- 1013 N 450 St E Unit 60
- 1031 N 525 E Unit 85
- 1263 N 325 E Unit 173
- 1116 N Jefferson Ave
- 1020 N 525 E Unit 91
- 1252 N 300 E Unit 180
- 1256 N 300 E Unit 179
- 1262 N 300 E Unit 178
- 1010 N 525 E Unit 90
- 1268 N 300 E Unit 177
- 318 E 1275 N Unit 115
- 526 E 980 N Unit 62
- 1001 N 550 E Unit 98
Your Personal Tour Guide
Ask me questions while you tour the home.