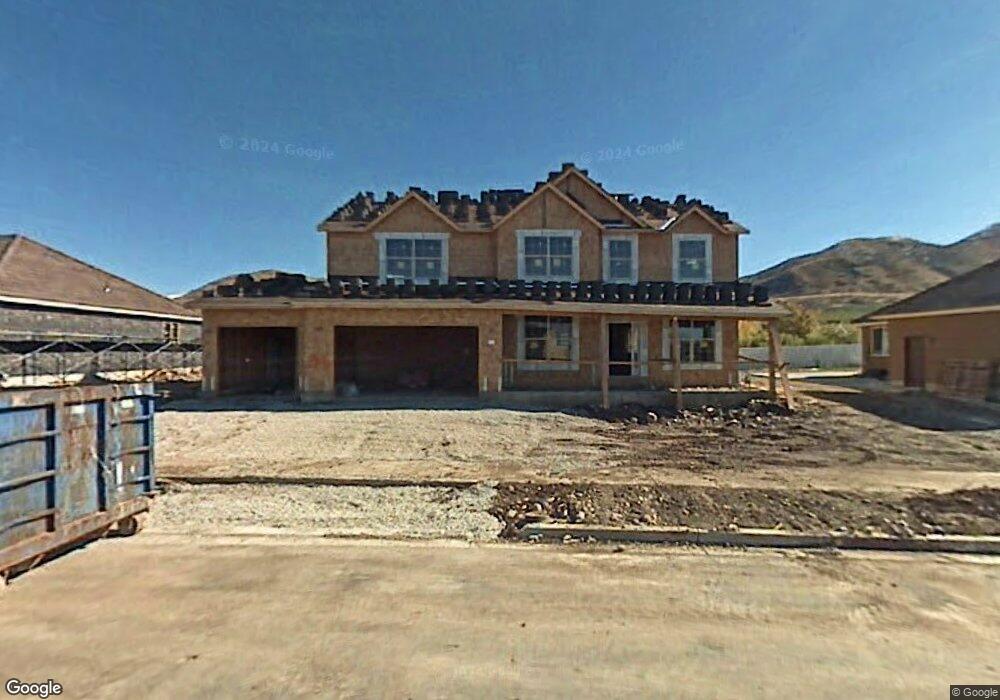
1203 S 300 E Payson, UT 84651
Estimated Value: $666,000 - $678,000
4
Beds
3
Baths
4,324
Sq Ft
$155/Sq Ft
Est. Value
About This Home
This home is located at 1203 S 300 E, Payson, UT 84651 and is currently estimated at $671,428, approximately $155 per square foot. 1203 S 300 E is a home located in Utah County with nearby schools including Park View Elementary, Payson High School, and Payson Junior High School.
Ownership History
Date
Name
Owned For
Owner Type
Purchase Details
Closed on
Oct 18, 2018
Sold by
Cortes Luis and Cortes Desiree
Bought by
Cortes Luis and Cortes Desiree
Current Estimated Value
Home Financials for this Owner
Home Financials are based on the most recent Mortgage that was taken out on this home.
Original Mortgage
$328,000
Outstanding Balance
$286,036
Interest Rate
4.5%
Mortgage Type
New Conventional
Estimated Equity
$385,392
Purchase Details
Closed on
Jan 2, 2008
Sold by
Richmond American Homes Of Utah Inc
Bought by
Griep John and Griep Lisa
Home Financials for this Owner
Home Financials are based on the most recent Mortgage that was taken out on this home.
Original Mortgage
$417,000
Interest Rate
5.96%
Mortgage Type
Purchase Money Mortgage
Create a Home Valuation Report for This Property
The Home Valuation Report is an in-depth analysis detailing your home's value as well as a comparison with similar homes in the area
Home Values in the Area
Average Home Value in this Area
Purchase History
| Date | Buyer | Sale Price | Title Company |
|---|---|---|---|
| Cortes Luis | -- | Us Title Insurance Agency | |
| Cortes Luis | -- | Utah First Title Ins Agency | |
| Griep John | -- | First American Union Park |
Source: Public Records
Mortgage History
| Date | Status | Borrower | Loan Amount |
|---|---|---|---|
| Open | Cortes Luis | $328,000 | |
| Previous Owner | Griep John | $417,000 |
Source: Public Records
Tax History
| Year | Tax Paid | Tax Assessment Tax Assessment Total Assessment is a certain percentage of the fair market value that is determined by local assessors to be the total taxable value of land and additions on the property. | Land | Improvement |
|---|---|---|---|---|
| 2025 | $3,372 | $360,250 | -- | -- |
| 2024 | $3,474 | $343,145 | $0 | $0 |
| 2023 | $3,474 | $354,530 | $0 | $0 |
| 2022 | $3,596 | $360,965 | $0 | $0 |
| 2021 | $3,064 | $493,200 | $113,300 | $379,900 |
| 2020 | $2,912 | $458,700 | $103,000 | $355,700 |
| 2019 | $2,730 | $440,900 | $85,200 | $355,700 |
| 2018 | $2,522 | $392,500 | $74,600 | $317,900 |
| 2017 | $2,260 | $189,145 | $0 | $0 |
| 2016 | $2,012 | $167,310 | $0 | $0 |
| 2015 | $1,823 | $150,590 | $0 | $0 |
| 2014 | $1,732 | $144,045 | $0 | $0 |
Source: Public Records
Map
Nearby Homes
- 389 E 1290 S
- 336 E 1330 S
- 1331 500 E Unit 120
- 288 E 900 S
- 876 Greenridge Ave
- 1872 100 E Unit 6
- 815 S Canyon Rd
- 826 S 600 E
- 1463 S 260 W
- 347 W 1380 S
- 252 E 670 S Unit 2
- 229 E 670 S Unit 7
- 420 E 600 S
- 528 W 1150 S
- 32 E 1690 S Unit 113
- 549 S Main St
- 588 W 1450 S
- 245 W 1770 S
- 609 W Saddlebrook Dr
- 613 W Saddlebrook Dr
Your Personal Tour Guide
Ask me questions while you tour the home.