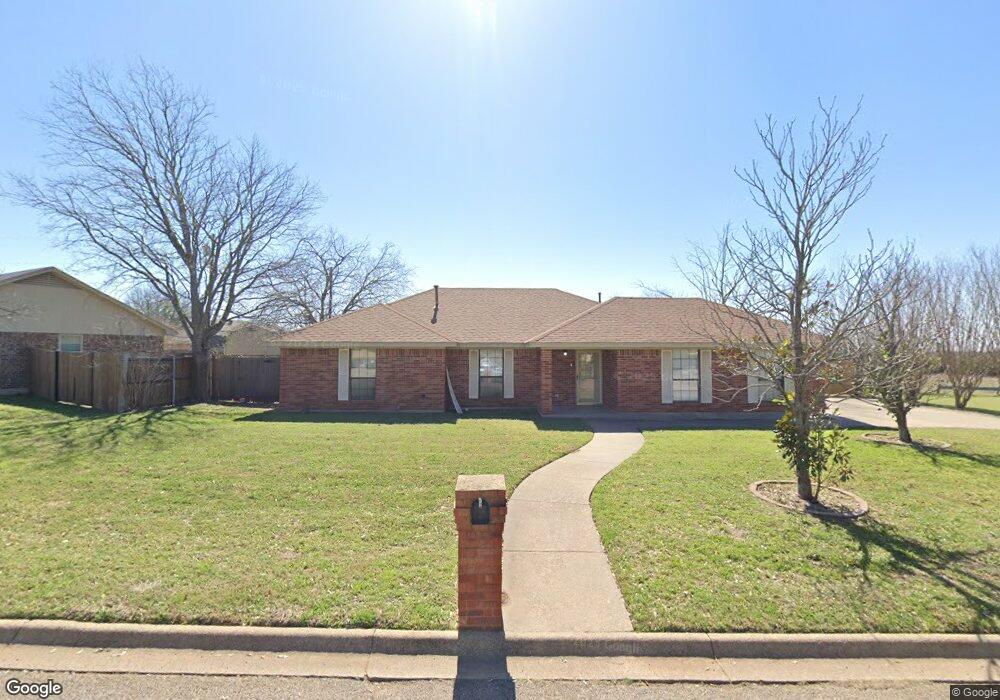
1203 Sandstone Dr Cleburne, TX 76033
Osage-North Fisk NeighborhoodEstimated Value: $242,000 - $255,000
3
Beds
2
Baths
1,393
Sq Ft
$179/Sq Ft
Est. Value
About This Home
This home is located at 1203 Sandstone Dr, Cleburne, TX 76033 and is currently estimated at $249,400, approximately $179 per square foot. 1203 Sandstone Dr is a home located in Johnson County with nearby schools including Gerard Elementary School, Lowell Smith Jr. Middle School, and Cleburne High School.
Ownership History
Date
Name
Owned For
Owner Type
Purchase Details
Closed on
May 15, 2020
Sold by
Monk Christopher L and Monk Donna
Bought by
Laramore Sarah
Current Estimated Value
Home Financials for this Owner
Home Financials are based on the most recent Mortgage that was taken out on this home.
Original Mortgage
$161,029
Outstanding Balance
$142,559
Interest Rate
3.25%
Mortgage Type
FHA
Estimated Equity
$106,841
Purchase Details
Closed on
Mar 28, 2014
Sold by
Campbell Wayne S and Campbell Kelli
Bought by
Monk Christopher L
Home Financials for this Owner
Home Financials are based on the most recent Mortgage that was taken out on this home.
Original Mortgage
$115,862
Interest Rate
4.75%
Mortgage Type
FHA
Purchase Details
Closed on
Sep 28, 2005
Sold by
Austin Donald E and Austin Virginia L
Bought by
Campbell Wayne S
Home Financials for this Owner
Home Financials are based on the most recent Mortgage that was taken out on this home.
Original Mortgage
$65,450
Interest Rate
5.73%
Mortgage Type
New Conventional
Create a Home Valuation Report for This Property
The Home Valuation Report is an in-depth analysis detailing your home's value as well as a comparison with similar homes in the area
Home Values in the Area
Average Home Value in this Area
Purchase History
| Date | Buyer | Sale Price | Title Company |
|---|---|---|---|
| Laramore Sarah | -- | None Available | |
| Monk Christopher L | -- | Providence Title Company | |
| Campbell Wayne S | -- | Fatco |
Source: Public Records
Mortgage History
| Date | Status | Borrower | Loan Amount |
|---|---|---|---|
| Open | Laramore Sarah | $161,029 | |
| Previous Owner | Monk Christopher L | $115,862 | |
| Previous Owner | Campbell Wayne S | $65,450 |
Source: Public Records
Tax History Compared to Growth
Tax History
| Year | Tax Paid | Tax Assessment Tax Assessment Total Assessment is a certain percentage of the fair market value that is determined by local assessors to be the total taxable value of land and additions on the property. | Land | Improvement |
|---|---|---|---|---|
| 2025 | $3,428 | $254,610 | $50,000 | $204,610 |
| 2024 | $4,812 | $215,804 | $0 | $0 |
| 2023 | $3,013 | $220,508 | $50,000 | $170,508 |
| 2022 | $4,463 | $200,267 | $42,000 | $158,267 |
| 2021 | $4,230 | $162,136 | $33,000 | $129,136 |
| 2020 | $4,150 | $149,755 | $28,000 | $121,755 |
| 2019 | $4,153 | $140,566 | $22,500 | $118,066 |
| 2018 | $3,910 | $132,271 | $22,500 | $109,771 |
| 2017 | $3,678 | $124,953 | $22,500 | $102,453 |
| 2016 | $3,357 | $114,022 | $12,500 | $101,522 |
| 2015 | $2,273 | $111,724 | $12,500 | $99,224 |
| 2014 | $2,273 | $85,289 | $12,500 | $72,789 |
Source: Public Records
Map
Nearby Homes
- 1307 Lynnwood Dr
- 1223 Country Club Rd
- 1105 Ashwood Ct
- 1411 Clearfield Dr
- 1423 Berry Dr
- 1104 Lynnwood Dr
- 1307 Bradley Ct
- 1304 Bradley Ct
- 1208 Cindy Ln
- 1302 Cindy Ct
- 1209 Stonelake Dr
- 1040 Monarch Dr
- 1327 Hemphill Dr
- 1603 American Dr
- 1027 Spring Azure Dr
- 1104 Cherrywood Dr
- 840 S Ridgeway Dr
- 1105 Hemphill Ct
- 1029 Spring Azure Dr
- 1602 Murry Dr
- 1201 Sandstone Dr
- 1302 Lynnwood Dr
- 1304 Lynnwood Dr
- 1301 Bluewater Dr
- 1204 Sandstone Dr
- 1202 Sandstone Dr
- 1306 Lynnwood Dr
- 1206 Sandstone Dr
- 1200 Sandstone Dr
- 1209 Sandstone Dr
- 1112 Lynnwood Ct
- 1115 Sandstone Dr
- 1208 Sandstone Dr
- 1308 Lynnwood Dr
- 1305 Lynnwood Dr
- 1116 Sandstone Dr
- 1211 Sandstone Dr
- 1210 Sandstone Dr
- 1205 Country Club Rd
- 1207 Country Club Rd