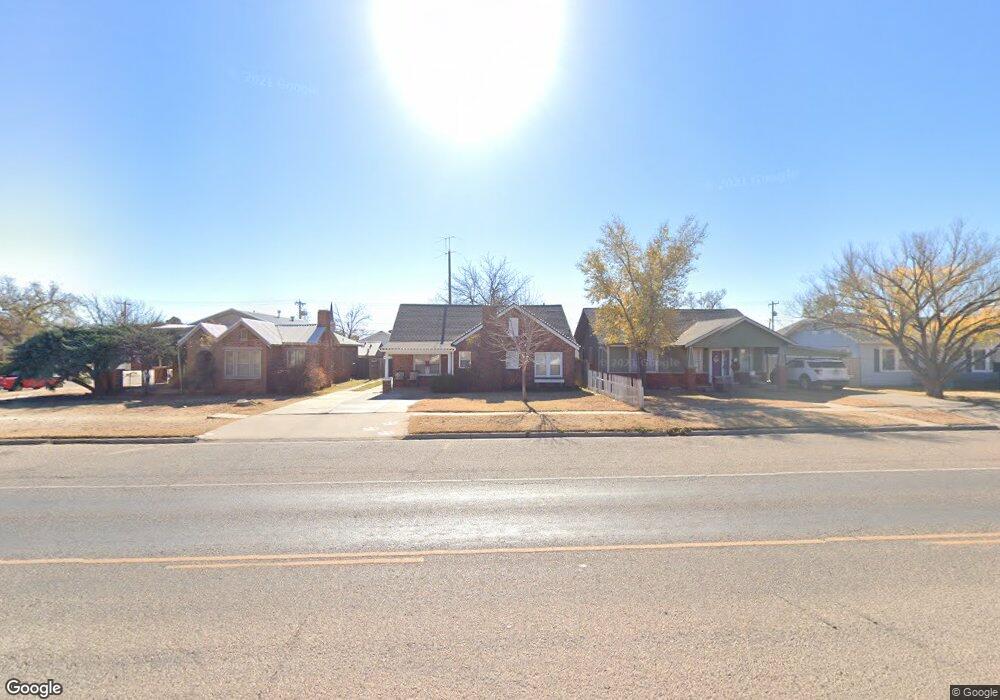
1203 W 11th St Plainview, TX 79072
Estimated Value: $103,000 - $113,000
3
Beds
1
Bath
1,176
Sq Ft
$91/Sq Ft
Est. Value
About This Home
This home is located at 1203 W 11th St, Plainview, TX 79072 and is currently estimated at $107,517, approximately $91 per square foot. 1203 W 11th St is a home located in Hale County with nearby schools including Coronado Middle School, Plainview High School, and First U M Calico Caboose.
Ownership History
Date
Name
Owned For
Owner Type
Purchase Details
Closed on
Jun 3, 2019
Sold by
Cook Joyce Maxine
Bought by
Sauceda Rebecca A
Current Estimated Value
Home Financials for this Owner
Home Financials are based on the most recent Mortgage that was taken out on this home.
Original Mortgage
$79,434
Outstanding Balance
$70,144
Interest Rate
4.62%
Mortgage Type
FHA
Estimated Equity
$37,373
Purchase Details
Closed on
Dec 15, 2017
Sold by
Hall Alexis
Bought by
Cook Paul Richard and Cook Joyce Maxine
Home Financials for this Owner
Home Financials are based on the most recent Mortgage that was taken out on this home.
Original Mortgage
$70,483
Interest Rate
3.94%
Mortgage Type
VA
Purchase Details
Closed on
Mar 29, 2012
Sold by
Esty Aaron and Esty Tracy
Bought by
Hall Alexis
Home Financials for this Owner
Home Financials are based on the most recent Mortgage that was taken out on this home.
Original Mortgage
$70,661
Interest Rate
3.5%
Mortgage Type
FHA
Create a Home Valuation Report for This Property
The Home Valuation Report is an in-depth analysis detailing your home's value as well as a comparison with similar homes in the area
Purchase History
| Date | Buyer | Sale Price | Title Company |
|---|---|---|---|
| Sauceda Rebecca A | -- | Hale County Abstract Co | |
| Cook Paul Richard | -- | Hale County Abstract Co | |
| Hall Alexis | -- | Countywide Title Company |
Source: Public Records
Mortgage History
| Date | Status | Borrower | Loan Amount |
|---|---|---|---|
| Open | Sauceda Rebecca A | $79,434 | |
| Previous Owner | Cook Paul Richard | $70,483 | |
| Previous Owner | Hall Alexis | $70,661 |
Source: Public Records
Tax History
| Year | Tax Paid | Tax Assessment Tax Assessment Total Assessment is a certain percentage of the fair market value that is determined by local assessors to be the total taxable value of land and additions on the property. | Land | Improvement |
|---|---|---|---|---|
| 2025 | $1,444 | $100,437 | $3,250 | $97,187 |
| 2024 | $2,675 | $100,437 | $3,250 | $97,187 |
| 2023 | $2,714 | $100,437 | $3,250 | $97,187 |
| 2022 | $2,471 | $87,919 | $3,250 | $84,669 |
| 2021 | $2,040 | $71,972 | $3,250 | $68,722 |
| 2020 | $1,805 | $71,224 | $3,250 | $67,974 |
| 2019 | $1,850 | $71,059 | $3,250 | $67,809 |
| 2018 | $1,708 | $71,059 | $3,250 | $67,809 |
| 2017 | $1,627 | $70,294 | $3,250 | $67,044 |
| 2016 | $1,525 | $70,294 | $3,250 | $67,044 |
| 2015 | -- | $68,104 | $3,250 | $64,854 |
| 2014 | -- | $67,444 | $3,250 | $64,194 |
Source: Public Records
Map
Nearby Homes
- 1109 W 9th St
- 1006 Nassau St
- 1004 Nassau St
- 807 Lexington St
- 906 W 12th St
- 1512 W 11th St
- 1104 Galveston St
- 1204 Galveston St
- 712 W 9th St
- 801 Fresno St
- 711 Fresno St
- 510 W 12th St
- 507 W 10th St
- 1107 Raleigh St
- 1205-1207 Raleigh St
- 1705 W 16th St
- 1305 Smythe St
- 1909 Kokomo St
- 2203 W 12th St
- 1808 W 18th St
- 1201 W 11th St
- 1205 W 11th St
- 1009 Kokomo St
- 1207 W 11th St
- 1209 W 11th St
- 1007 Kokomo St
- 1111 W 11th St
- 1211 W 11th St
- 1005 Kokomo St
- 1006 Lexington St
- 1109 W 11th St
- 1202 W 11th St
- 1003 Kokomo St
- 1004 Lexington St
- 1204 W 11th St
- 1200 W 11th St
- 1006 Kokomo St
- 1107 W 11th St
- 1206 W 11th St
- 1208 W 11th St
Your Personal Tour Guide
Ask me questions while you tour the home.