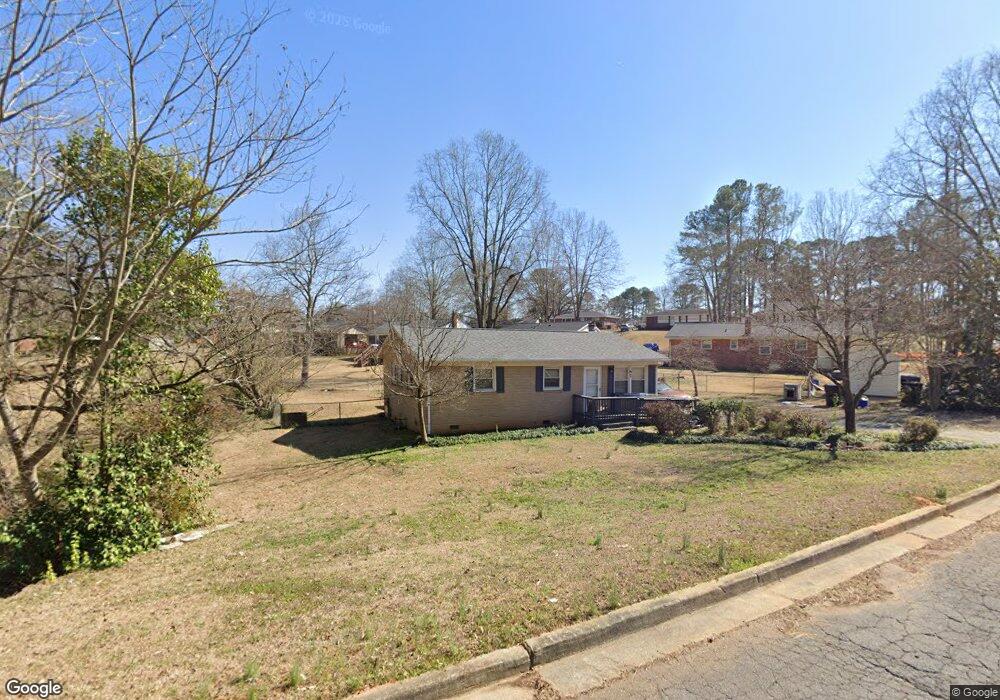
1203 Westover Cir Rock Hill, SC 29732
Estimated Value: $276,000 - $290,000
3
Beds
2
Baths
1,045
Sq Ft
$271/Sq Ft
Est. Value
About This Home
This home is located at 1203 Westover Cir, Rock Hill, SC 29732 and is currently estimated at $283,117, approximately $270 per square foot. 1203 Westover Cir is a home located in York County with nearby schools including Dutchman Creek Middle School, Northwestern High School, and Providence Classical School.
Ownership History
Date
Name
Owned For
Owner Type
Purchase Details
Closed on
Apr 30, 2015
Sold by
Lloyd Brandon Z
Bought by
Gray India M
Current Estimated Value
Home Financials for this Owner
Home Financials are based on the most recent Mortgage that was taken out on this home.
Original Mortgage
$5,000
Outstanding Balance
$3,869
Interest Rate
3.8%
Mortgage Type
Unknown
Estimated Equity
$279,248
Purchase Details
Closed on
Jun 24, 2005
Sold by
Westmoreland Laura A
Bought by
Roldan Jessica
Home Financials for this Owner
Home Financials are based on the most recent Mortgage that was taken out on this home.
Original Mortgage
$113,984
Interest Rate
5.57%
Mortgage Type
FHA
Purchase Details
Closed on
Jan 7, 2005
Sold by
Westmoreland Laura A
Bought by
Westmoreland Laura A
Purchase Details
Closed on
Jul 26, 2001
Sold by
Tan Rick Management Inc
Bought by
Westmoreland Robert L and Westmoreland Laura A
Purchase Details
Closed on
Mar 7, 2001
Sold by
Oliphant Boyd & Wheat Llc
Bought by
Tan Rick Management Inc
Create a Home Valuation Report for This Property
The Home Valuation Report is an in-depth analysis detailing your home's value as well as a comparison with similar homes in the area
Home Values in the Area
Average Home Value in this Area
Purchase History
| Date | Buyer | Sale Price | Title Company |
|---|---|---|---|
| Gray India M | $134,900 | -- | |
| Roldan Jessica | $115,000 | -- | |
| Westmoreland Laura A | -- | -- | |
| Westmoreland Robert L | $107,900 | -- | |
| Tan Rick Management Inc | $225,500 | -- |
Source: Public Records
Mortgage History
| Date | Status | Borrower | Loan Amount |
|---|---|---|---|
| Open | Gray India M | $5,000 | |
| Open | Gray India M | $132,456 | |
| Previous Owner | Roldan Jessica | $113,984 |
Source: Public Records
Tax History Compared to Growth
Tax History
| Year | Tax Paid | Tax Assessment Tax Assessment Total Assessment is a certain percentage of the fair market value that is determined by local assessors to be the total taxable value of land and additions on the property. | Land | Improvement |
|---|---|---|---|---|
| 2024 | $1,171 | $5,339 | $1,200 | $4,139 |
| 2023 | $1,175 | $5,339 | $1,200 | $4,139 |
| 2022 | $1,183 | $5,339 | $1,200 | $4,139 |
| 2021 | -- | $5,339 | $1,200 | $4,139 |
| 2020 | $1,185 | $5,339 | $0 | $0 |
| 2019 | $1,150 | $5,020 | $0 | $0 |
| 2018 | $1,148 | $5,020 | $0 | $0 |
| 2017 | $1,106 | $5,020 | $0 | $0 |
| 2016 | $1,096 | $5,020 | $0 | $0 |
| 2014 | $2,584 | $4,020 | $1,200 | $2,820 |
| 2013 | $2,584 | $4,540 | $1,200 | $3,340 |
Source: Public Records
Map
Nearby Homes
- 851 Gist Rd
- 861 Carey Dr
- 842 S Cherry Rd
- 1024 Westover Cir
- 536 Glenn St
- 823 Prestwick Dr
- 1650 W Main St
- 564 Menzies Dr
- 1609 Begonia Way
- 532 Jedburgh Way
- 1625 Begonia Way
- 1269 Longview Rd
- 1195 Cavalier Ln
- 1118 Sanders St
- 309 Haddington Ct
- 1441 Spring View Ct
- 1257 Reese Roach Rd
- 1406 Hinson Ln
- 235 Florence St
- 1540 Coatsworth Ln
- 1203 Westover Cir
- 1191 Westover Cir Unit 74
- 874 Carey Dr
- 882 Carey Dr
- 868 Carey Dr
- 1181 Westover Cir
- 862 Carey Dr
- 1210 Westover Cir
- 1204 Westover Cir
- 1216 Westover Cir
- 856 Carey Dr
- 1222 Westover Cir
- 857 Gist Rd
- 1186 Westover Cir
- 883 Carey Dr
- 883 Carey Dr Unit 70
- 877 Carey Dr
- 1228 Westover Cir
- 850 Carey Dr
- 1180 Westover Cir