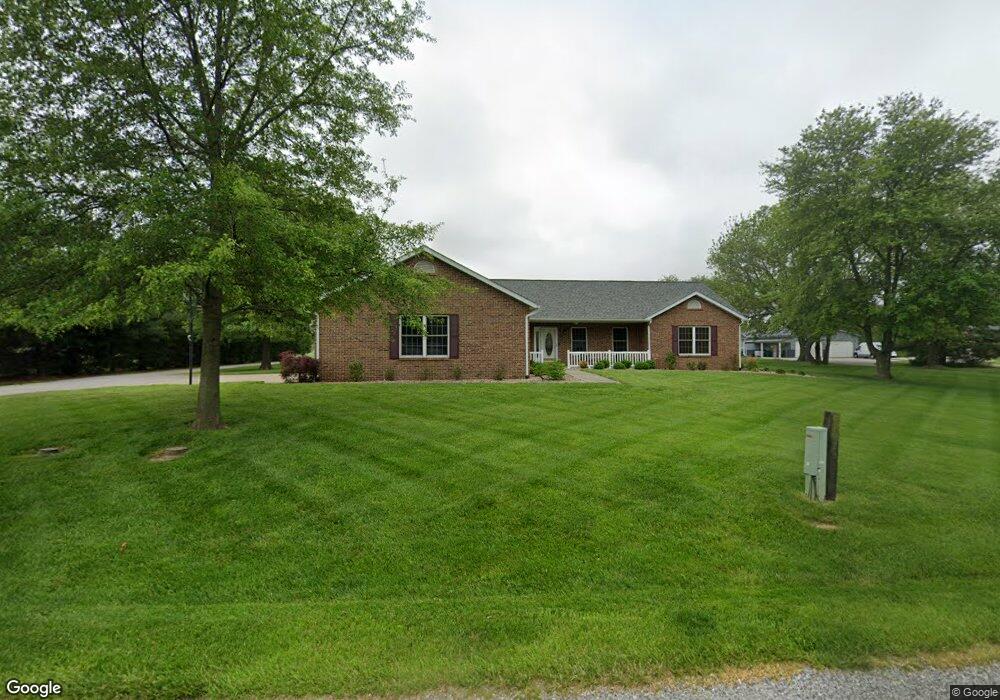
1203 Wolf Rd Freeburg, IL 62243
Estimated Value: $182,000 - $451,000
--
Bed
--
Bath
2,171
Sq Ft
$146/Sq Ft
Est. Value
About This Home
This home is located at 1203 Wolf Rd, Freeburg, IL 62243 and is currently estimated at $316,500, approximately $145 per square foot. 1203 Wolf Rd is a home located in St. Clair County with nearby schools including Freeburg Elementary School, Freeburg Community High School, and St. Joseph Catholic School.
Ownership History
Date
Name
Owned For
Owner Type
Purchase Details
Closed on
Apr 2, 2025
Sold by
Long Jamie Leavitt and Horton Jamie Leavitt
Bought by
Horton Bradley David
Current Estimated Value
Purchase Details
Closed on
Aug 10, 2018
Sold by
Dill Mark C and Dill Amanda S
Bought by
Long Jamie Leabitt and Long Bardley David
Home Financials for this Owner
Home Financials are based on the most recent Mortgage that was taken out on this home.
Original Mortgage
$251,000
Interest Rate
4.5%
Mortgage Type
New Conventional
Purchase Details
Closed on
Sep 19, 2003
Sold by
R S & D Investments Inc
Bought by
Dill Mark C and Dill Amanda S
Home Financials for this Owner
Home Financials are based on the most recent Mortgage that was taken out on this home.
Original Mortgage
$199,800
Interest Rate
6.44%
Mortgage Type
Balloon
Create a Home Valuation Report for This Property
The Home Valuation Report is an in-depth analysis detailing your home's value as well as a comparison with similar homes in the area
Home Values in the Area
Average Home Value in this Area
Purchase History
| Date | Buyer | Sale Price | Title Company |
|---|---|---|---|
| Horton Bradley David | $165,000 | Town & Country Title | |
| Long Jamie Leabitt | $302,000 | First American Title | |
| Dill Mark C | $222,000 | Metro East Title |
Source: Public Records
Mortgage History
| Date | Status | Borrower | Loan Amount |
|---|---|---|---|
| Previous Owner | Long Jamie Leabitt | $251,000 | |
| Previous Owner | Dill Mark C | $199,800 |
Source: Public Records
Tax History Compared to Growth
Tax History
| Year | Tax Paid | Tax Assessment Tax Assessment Total Assessment is a certain percentage of the fair market value that is determined by local assessors to be the total taxable value of land and additions on the property. | Land | Improvement |
|---|---|---|---|---|
| 2024 | $9,954 | $126,540 | $18,977 | $107,563 |
| 2023 | $9,362 | $117,613 | $17,638 | $99,975 |
| 2022 | $8,759 | $107,942 | $16,188 | $91,754 |
| 2021 | $8,403 | $101,640 | $15,243 | $86,397 |
| 2020 | $7,037 | $82,988 | $14,706 | $68,282 |
| 2019 | $6,823 | $82,988 | $14,706 | $68,282 |
| 2018 | $6,569 | $80,081 | $14,191 | $65,890 |
| 2017 | $6,526 | $76,370 | $13,533 | $62,837 |
| 2016 | $6,761 | $79,577 | $13,768 | $65,809 |
| 2014 | $5,815 | $78,309 | $13,549 | $64,760 |
| 2013 | $5,349 | $80,013 | $13,844 | $66,169 |
Source: Public Records
Map
Nearby Homes
- 363 Sleeping Indian Dr
- 359 Sleeping Indian Dr
- 227 Alamosa Dr
- 222 Alamosa Dr
- 433 Foxtail Dr
- 304 Torrington Ln
- 440 Foxtail Dr
- 420 Foxtail Dr
- 302 N Railroad St
- 206 N Main St
- 312 W Phillips St
- 401 N Edison St
- 5433 Kraft Rd
- 207 N Edison St
- 520 N Edison St
- TBB Kraft Rd
- 106 S Vine St
- 3402 Arbor View Ct
- 3 Park St
- 5548 High St
- 601 Niebruegge Ln
- 1207 Wolf Rd
- 600 Niebruegge Ln
- 1209 Wolf Rd
- 1220 Wolf Rd
- 1201 Wolf Rd
- 651 Niebruegge Ln
- 650 Niebruegge Ln
- 0X Foxtail Dr
- 700 Niebruegge Ln
- 701 Niebruegge Ln
- 751 Niebruegge Ln
- 1225 Wolf Rd
- 711 Niebruegge Ln
- 750 Niebruegge Ln
- 417 Telluride Dr
- 1230 Wolf Rd
- 1237 Wolf Rd
- 413 Telluride Dr
- 419 Silverthorne Dr