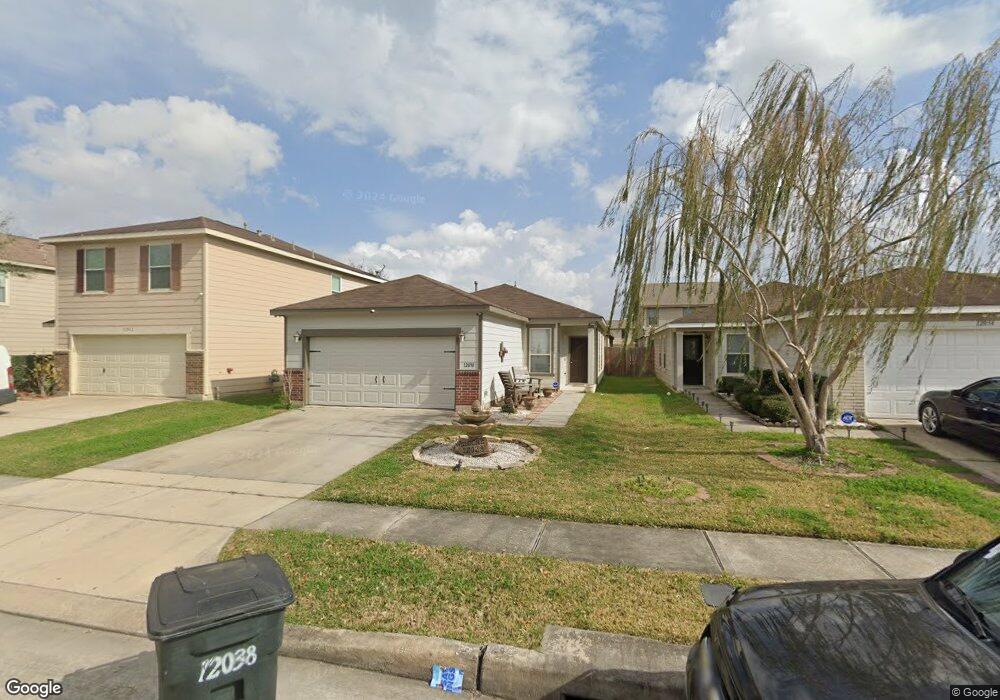
12038 Chelsea Elm Ct Houston, TX 77038
North Houston NeighborhoodEstimated Value: $212,000 - $228,000
3
Beds
2
Baths
1,363
Sq Ft
$161/Sq Ft
Est. Value
About This Home
This home is located at 12038 Chelsea Elm Ct, Houston, TX 77038 and is currently estimated at $219,174, approximately $160 per square foot. 12038 Chelsea Elm Ct is a home located in Harris County with nearby schools including Kujawa EC/Pre-K/K School, Carter Academy, and Shotwell Middle School.
Ownership History
Date
Name
Owned For
Owner Type
Purchase Details
Closed on
Jul 16, 2015
Sold by
The Secretary Of Hud
Bought by
Lopez Juan M Saavedra and Castillo Ruth Elizabeth Martinez
Current Estimated Value
Home Financials for this Owner
Home Financials are based on the most recent Mortgage that was taken out on this home.
Original Mortgage
$88,000
Outstanding Balance
$68,713
Interest Rate
3.9%
Mortgage Type
New Conventional
Estimated Equity
$150,461
Purchase Details
Closed on
Sep 18, 2014
Sold by
Lakeview Loan Servicing Lc
Bought by
The Sercretary Of Hud
Purchase Details
Closed on
Sep 2, 2014
Sold by
Torres Jose E and Morales Tabitha
Bought by
Lakeview Loan Servicing Llc
Purchase Details
Closed on
Feb 26, 2010
Sold by
Kb Home Loan Star Inc
Bought by
Torres Jose E
Home Financials for this Owner
Home Financials are based on the most recent Mortgage that was taken out on this home.
Original Mortgage
$94,256
Interest Rate
5.25%
Mortgage Type
FHA
Create a Home Valuation Report for This Property
The Home Valuation Report is an in-depth analysis detailing your home's value as well as a comparison with similar homes in the area
Home Values in the Area
Average Home Value in this Area
Purchase History
| Date | Buyer | Sale Price | Title Company |
|---|---|---|---|
| Lopez Juan M Saavedra | -- | None Available | |
| The Sercretary Of Hud | -- | None Available | |
| Lakeview Loan Servicing Llc | $105,688 | None Available | |
| Torres Jose E | -- | First American Title |
Source: Public Records
Mortgage History
| Date | Status | Borrower | Loan Amount |
|---|---|---|---|
| Open | Lopez Juan M Saavedra | $88,000 | |
| Previous Owner | Torres Jose E | $94,256 |
Source: Public Records
Tax History Compared to Growth
Tax History
| Year | Tax Paid | Tax Assessment Tax Assessment Total Assessment is a certain percentage of the fair market value that is determined by local assessors to be the total taxable value of land and additions on the property. | Land | Improvement |
|---|---|---|---|---|
| 2025 | $4,883 | $212,606 | $43,560 | $169,046 |
| 2024 | $4,883 | $212,606 | $43,560 | $169,046 |
| 2023 | $4,883 | $215,413 | $43,560 | $171,853 |
| 2022 | $5,591 | $187,991 | $26,400 | $161,591 |
| 2021 | $5,280 | $158,302 | $26,400 | $131,902 |
| 2020 | $4,961 | $143,392 | $26,400 | $116,992 |
| 2019 | $4,646 | $126,284 | $19,800 | $106,484 |
| 2018 | $1,343 | $118,551 | $19,800 | $98,751 |
| 2017 | $4,228 | $118,551 | $19,800 | $98,751 |
| 2016 | $4,063 | $113,931 | $19,800 | $94,131 |
| 2015 | $3,171 | $100,230 | $19,800 | $80,430 |
| 2014 | $3,171 | $89,841 | $19,800 | $70,041 |
Source: Public Records
Map
Nearby Homes
- 12007 Bach Orchard Trail
- 2702 Urban Glen Ct
- 12015 Audubon Hill Ct
- 12042 Mallard Stream Ct
- 12006 Mallard Stream Ct
- 2907 Valiant Scene Ct
- 2743 Oriole Wood Ct
- 2934 Valiant Scene Ct
- 12026 Madison Oak St
- 2746 Piney Lake Ct
- 2610 Cabin Cove Ln
- 2606 Oakwood Bluff Trail
- 12518 Pelican Bay Dr
- 11726 Wren Crossing Dr
- 2631 Palmetto Valley Dr
- Whitetail Plan at Forestwood
- Kitson Plan at Forestwood
- Pinehollow Plan at Forestwood
- 12530 Wild Strawberry Rd
- Idlewood Plan at Forestwood
- 12042 Chelsea Elm Ct
- 12034 Chelsea Elm Ct
- 12030 Chelsea Elm Ct
- 12046 Chelsea Elm Ct
- 12039 Yosemite Glen Trail
- 12035 Yosemite Glen Trail
- 12043 Yosemite Glen Trail
- 12050 Chelsea Elm Ct
- 12047 Yosemite Glen Trail
- 12031 Yosemite Glen Trail
- 12026 Chelsea Elm Ct
- 12027 Yosemite Glen Trail
- 12022 Chelsea Elm Ct
- 12039 Chelsea Elm Ct
- 12054 Chelsea Elm Ct
- 12035 Chelsea Elm Ct
- 12051 Yosemite Glen Trail
- 12043 Chelsea Elm Ct
- 12031 Chelsea Elm Ct
- 12047 Chelsea Elm Ct