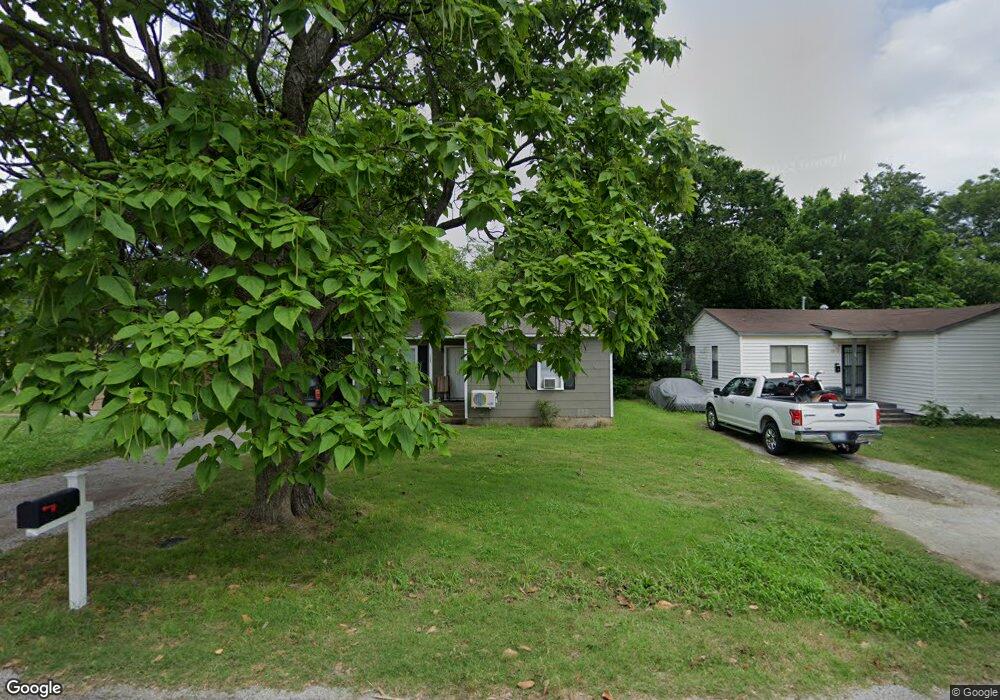
1204 A St SE Ardmore, OK 73401
Estimated Value: $74,440 - $111,000
3
Beds
1
Bath
979
Sq Ft
$97/Sq Ft
Est. Value
About This Home
This home is located at 1204 A St SE, Ardmore, OK 73401 and is currently estimated at $95,147, approximately $97 per square foot. 1204 A St SE is a home located in Carter County with nearby schools including Jefferson Elementary School, Ardmore Middle School, and Ardmore High School.
Ownership History
Date
Name
Owned For
Owner Type
Purchase Details
Closed on
Sep 26, 2019
Sold by
Richards Carey Scott and Richards Lisa Ann
Bought by
White Rock Investments Llc
Current Estimated Value
Home Financials for this Owner
Home Financials are based on the most recent Mortgage that was taken out on this home.
Original Mortgage
$46,607
Outstanding Balance
$40,913
Interest Rate
3.6%
Mortgage Type
Commercial
Estimated Equity
$54,234
Purchase Details
Closed on
Jan 26, 2015
Sold by
Richards Doras J
Bought by
Richards Carey Scott
Create a Home Valuation Report for This Property
The Home Valuation Report is an in-depth analysis detailing your home's value as well as a comparison with similar homes in the area
Home Values in the Area
Average Home Value in this Area
Purchase History
| Date | Buyer | Sale Price | Title Company |
|---|---|---|---|
| White Rock Investments Llc | $23,000 | None Available | |
| Richards Carey Scott | -- | None Available |
Source: Public Records
Mortgage History
| Date | Status | Borrower | Loan Amount |
|---|---|---|---|
| Open | White Rock Investments Llc | $46,607 |
Source: Public Records
Tax History Compared to Growth
Tax History
| Year | Tax Paid | Tax Assessment Tax Assessment Total Assessment is a certain percentage of the fair market value that is determined by local assessors to be the total taxable value of land and additions on the property. | Land | Improvement |
|---|---|---|---|---|
| 2024 | $331 | $3,355 | $818 | $2,537 |
| 2023 | $315 | $3,194 | $803 | $2,391 |
| 2022 | $291 | $3,042 | $786 | $2,256 |
| 2021 | $292 | $2,898 | $724 | $2,174 |
| 2020 | $274 | $2,760 | $178 | $2,582 |
| 2019 | $310 | $3,188 | $178 | $3,010 |
| 2018 | $300 | $3,036 | $178 | $2,858 |
| 2017 | $264 | $2,892 | $178 | $2,714 |
| 2016 | $257 | $2,753 | $178 | $2,575 |
| 2015 | $202 | $2,623 | $178 | $2,445 |
| 2014 | $192 | $2,498 | $178 | $2,320 |
Source: Public Records
Map
Nearby Homes
- 1000 Hugo St SE
- 901 A St SE
- 210 9th Ave SE
- 837 C St SE
- 1024 C St SW
- 812 C St SE
- 1118 Heath St SE
- 1108 Douglas St SE
- 1014 S Commerce St
- 914 Hailey St SW
- 613 F St SW
- 808 Carter St SE
- 511 7th Ave SE
- 616 8th Ave SE
- 1413 Sunny Ln
- 1501 Rosedale St
- 1500 Rosedale St
- 310 4th Ave SE
- 603 6th Ave SE
- 1507 Sunny Ln