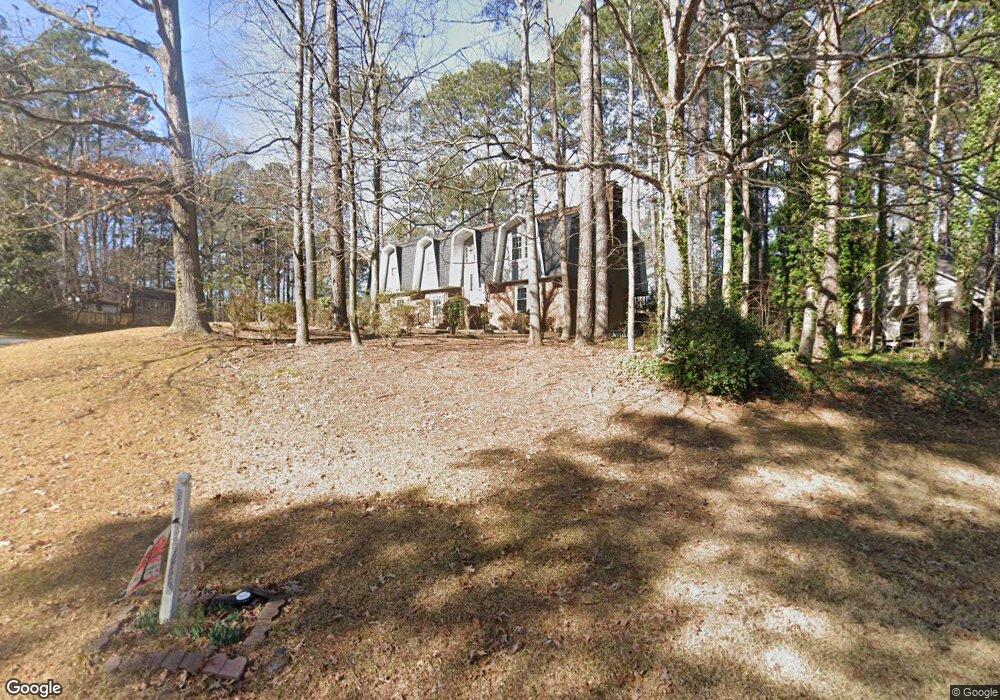
1204 Brookgreen Dr Cary, NC 27511
South Cary NeighborhoodEstimated Value: $469,710 - $530,000
4
Beds
3
Baths
2,252
Sq Ft
$218/Sq Ft
Est. Value
About This Home
This home is located at 1204 Brookgreen Dr, Cary, NC 27511 and is currently estimated at $490,178, approximately $217 per square foot. 1204 Brookgreen Dr is a home located in Wake County with nearby schools including Briarcliff Elementary School, East Cary Middle School, and Cary High School.
Ownership History
Date
Name
Owned For
Owner Type
Purchase Details
Closed on
Mar 29, 2005
Sold by
Cooper Gary D and Cooper Kimberly A
Bought by
Shannon Edward J and Shannon Tracey M
Current Estimated Value
Home Financials for this Owner
Home Financials are based on the most recent Mortgage that was taken out on this home.
Original Mortgage
$161,900
Outstanding Balance
$88,055
Interest Rate
6.62%
Mortgage Type
Fannie Mae Freddie Mac
Estimated Equity
$402,123
Purchase Details
Closed on
Apr 20, 2001
Sold by
Thompson Thompson Kenneth C
Bought by
Cooper Gary D and Cooper Kimberly A
Home Financials for this Owner
Home Financials are based on the most recent Mortgage that was taken out on this home.
Original Mortgage
$144,900
Interest Rate
6.99%
Purchase Details
Closed on
Oct 30, 1998
Sold by
Taber Allan S
Bought by
Thompson Kenneth C and Thompson Elizabeth K
Home Financials for this Owner
Home Financials are based on the most recent Mortgage that was taken out on this home.
Original Mortgage
$135,643
Interest Rate
9%
Create a Home Valuation Report for This Property
The Home Valuation Report is an in-depth analysis detailing your home's value as well as a comparison with similar homes in the area
Home Values in the Area
Average Home Value in this Area
Purchase History
| Date | Buyer | Sale Price | Title Company |
|---|---|---|---|
| Shannon Edward J | $180,000 | -- | |
| Cooper Gary D | $161,000 | -- | |
| Thompson Kenneth C | $158,000 | -- |
Source: Public Records
Mortgage History
| Date | Status | Borrower | Loan Amount |
|---|---|---|---|
| Open | Shannon Edward J | $161,900 | |
| Previous Owner | Cooper Gary D | $144,900 | |
| Previous Owner | Thompson Kenneth C | $135,643 |
Source: Public Records
Tax History
| Year | Tax Paid | Tax Assessment Tax Assessment Total Assessment is a certain percentage of the fair market value that is determined by local assessors to be the total taxable value of land and additions on the property. | Land | Improvement |
|---|---|---|---|---|
| 2025 | $3,640 | $422,351 | $210,000 | $212,351 |
| 2024 | $3,561 | $422,351 | $210,000 | $212,351 |
Source: Public Records
Map
Nearby Homes
- 104 Tapestry Terrace
- 1300 Brookgreen Dr
- 203 Mainsail Dr
- 1000 Brookgreen Dr
- 220 Riverwalk Cir
- 201 Riverwalk Cir
- 143 Spring Cove Dr
- 1517 Laughridge Dr
- 103 Lakeway Ct
- 105 Fox Horn Run
- 115 Inverness Ct
- 106 Bogue Ct
- 109 Prince William Ln
- 103 Inverness Ct
- 116 Inverness Ct
- 104 Charter Ct
- 806 Oakley Ct
- 417 Applecross Dr
- 213 King George Loop
- 106 Wimbledon Ct
- 1202 Brookgreen Dr
- 1202 Larkhall Ct
- 1201 Larkhall Ct
- 1204 Larkhall Ct
- 1301 Larkhall Ct
- 1226 Lochcarron Ln
- 1203 Larkhall Ct
- 1207 Brookgreen Dr
- 1201 Brookgreen Dr
- 1208 Brookgreen Dr
- 1205 Larkhall Ct
- 1206 Larkhall Ct
- 1224 Lochcarron Ln
- 106 Tapestry Terrace
- 1207 Larkhall Ct
- 108 Tapestry Terrace
- 1209 Brookgreen Dr
- 1115 Brookgreen Dr
- 1253 Gatehouse Dr
- 110 Tapestry Terrace
Your Personal Tour Guide
Ask me questions while you tour the home.