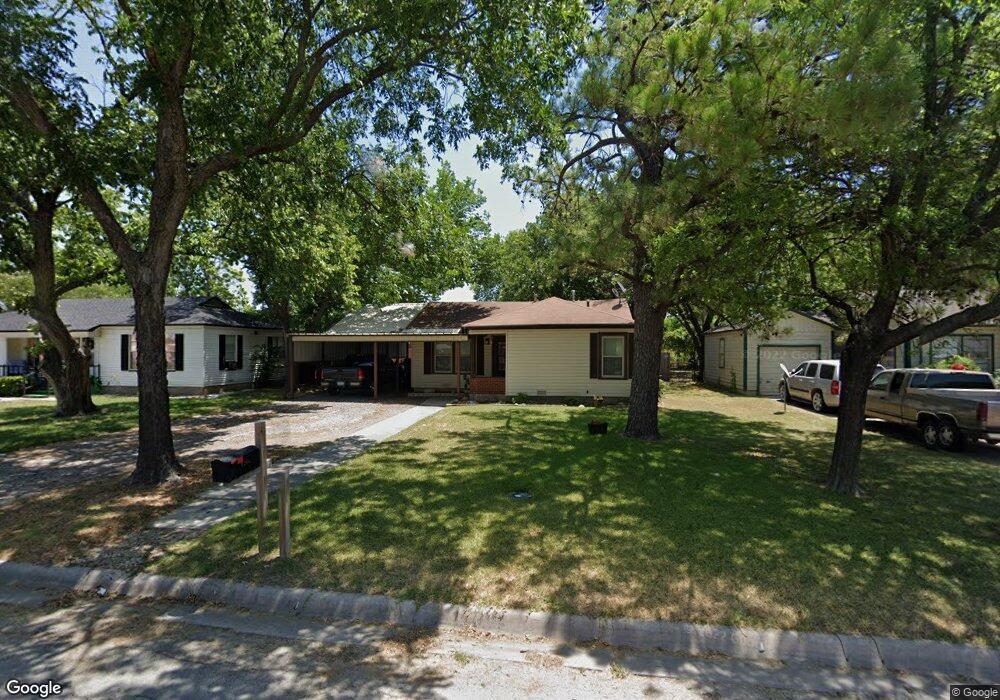
1204 N Morris St Gainesville, TX 76240
Estimated Value: $175,000 - $205,000
2
Beds
2
Baths
1,204
Sq Ft
$158/Sq Ft
Est. Value
About This Home
This home is located at 1204 N Morris St, Gainesville, TX 76240 and is currently estimated at $190,083, approximately $157 per square foot. 1204 N Morris St is a home located in Cooke County with nearby schools including Edison Elementary School, W.E. Chalmers Elementary School, and Gainesville Intermediate School.
Ownership History
Date
Name
Owned For
Owner Type
Purchase Details
Closed on
Sep 2, 2022
Sold by
Vandyke Douglas C and Vandyke Lori
Bought by
Alvarado Arnulfo and Alvarado Maria G
Current Estimated Value
Purchase Details
Closed on
Jul 9, 2019
Sold by
Camp Tim Fred
Bought by
Vandyke Douglas C and Vandyke Lori
Home Financials for this Owner
Home Financials are based on the most recent Mortgage that was taken out on this home.
Original Mortgage
$71,780
Interest Rate
3.9%
Mortgage Type
New Conventional
Purchase Details
Closed on
Mar 5, 2010
Sold by
Fuhrmann Dennis Ray
Bought by
Camp Fred L and Camp Pamela D
Home Financials for this Owner
Home Financials are based on the most recent Mortgage that was taken out on this home.
Original Mortgage
$73,150
Interest Rate
5.37%
Mortgage Type
FHA
Purchase Details
Closed on
May 10, 2006
Sold by
Fuhrmann Deborah D
Bought by
Fuhrmann Dennis Ray
Create a Home Valuation Report for This Property
The Home Valuation Report is an in-depth analysis detailing your home's value as well as a comparison with similar homes in the area
Home Values in the Area
Average Home Value in this Area
Purchase History
| Date | Buyer | Sale Price | Title Company |
|---|---|---|---|
| Alvarado Arnulfo | -- | Howeth Title | |
| Alvarado Arnulfo | -- | Howeth Title | |
| Vandyke Douglas C | -- | Howeth Title Company | |
| Camp Fred L | -- | -- | |
| Fuhrmann Dennis Ray | -- | -- |
Source: Public Records
Mortgage History
| Date | Status | Borrower | Loan Amount |
|---|---|---|---|
| Previous Owner | Vandyke Douglas C | $71,780 | |
| Previous Owner | Camp Fred L | $73,150 |
Source: Public Records
Tax History Compared to Growth
Tax History
| Year | Tax Paid | Tax Assessment Tax Assessment Total Assessment is a certain percentage of the fair market value that is determined by local assessors to be the total taxable value of land and additions on the property. | Land | Improvement |
|---|---|---|---|---|
| 2025 | $3,346 | $176,542 | $36,630 | $139,912 |
| 2024 | $3,346 | $176,542 | $36,630 | $139,912 |
| 2023 | $2,887 | $147,165 | $33,300 | $113,865 |
| 2022 | $2,697 | $138,743 | $29,700 | $109,043 |
| 2021 | $2,900 | $112,640 | $19,800 | $92,840 |
| 2020 | $2,840 | $106,922 | $18,900 | $88,022 |
| 2019 | $2,383 | $95,583 | $18,900 | $76,683 |
| 2018 | $2,163 | $79,253 | $9,450 | $69,803 |
| 2017 | $2,067 | $76,031 | $9,450 | $66,581 |
| 2015 | $711 | $72,194 | $9,450 | $62,744 |
| 2014 | $711 | $69,001 | $9,450 | $59,551 |
Source: Public Records
Map
Nearby Homes
- 1306 N Clements St
- TBD County Road 208
- 764
- 1305 Hillcrest Blvd
- 802 Myrtle St
- 901 N Morris St
- 1016 N Howeth St
- 1113 Fair Ave
- 811 Ritchey St
- 805 Ritchey St
- 1102 Fair Ave
- Lot #2 Belcher St
- Lot #1 Belcher St
- Lot #3 Belcher St
- 1520 Olive St
- 625 Denison St
- 1109 Elmwood St
- TBD E Highway 82
- 608 Ritchey St
- 605 N Schopmeyer St
- 1206 N Morris St
- 1202 N Morris St
- 1208 N Morris St
- 1200 N Morris St
- 1205 N Morris St
- 1209 N Grand Ave
- 1207 N Morris St
- 1203 N Morris St
- 1114 N Morris St
- 1201 N Morris St
- 1113 N Morris St
- 1112 N Morris St
- 1005 E Star St
- 1004 E Cloud St
- 1207 N Grand Ave
- 1110 N Morris St
- 83 Courtney Ln Unit 123
- 1003 E Star St
- 1111 N Morris St
- 1002 E Cloud St