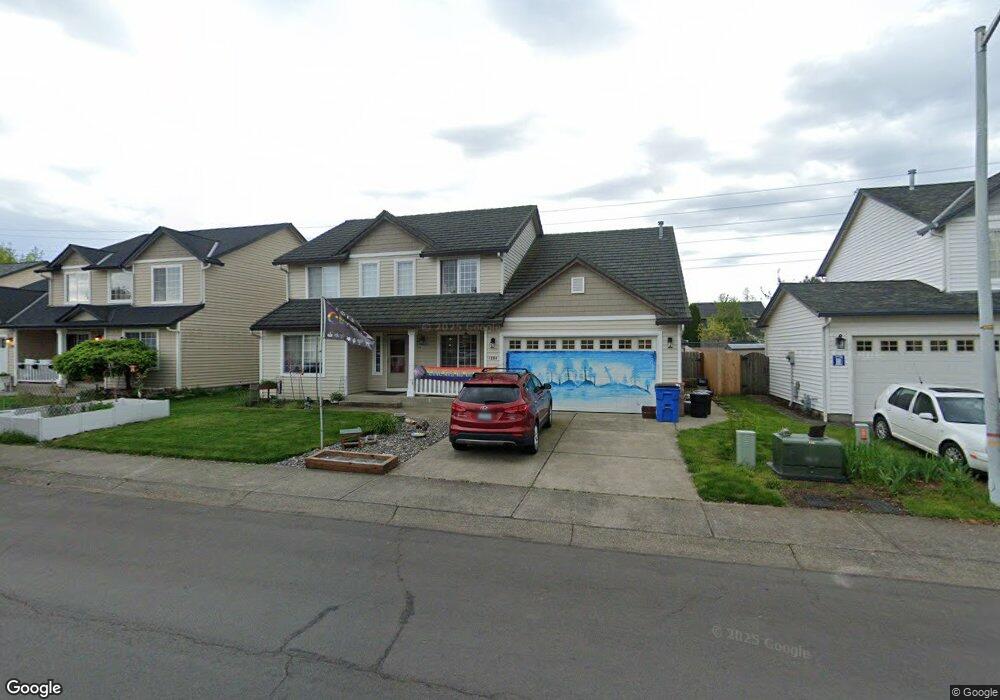
1204 NE 167th Ave Vancouver, WA 98684
Mill Plain NeighborhoodEstimated Value: $573,000 - $618,000
3
Beds
3
Baths
2,485
Sq Ft
$241/Sq Ft
Est. Value
About This Home
This home is located at 1204 NE 167th Ave, Vancouver, WA 98684 and is currently estimated at $599,710, approximately $241 per square foot. 1204 NE 167th Ave is a home located in Clark County with nearby schools including Illahee Elementary School, Shahala Middle School, and Union High School.
Ownership History
Date
Name
Owned For
Owner Type
Purchase Details
Closed on
Jun 14, 2011
Sold by
Read Terry A and Read Laura R
Bought by
Boles Robert and Carr Karen E
Current Estimated Value
Home Financials for this Owner
Home Financials are based on the most recent Mortgage that was taken out on this home.
Original Mortgage
$208,087
Outstanding Balance
$140,865
Interest Rate
4.25%
Mortgage Type
FHA
Estimated Equity
$458,845
Purchase Details
Closed on
Sep 27, 2001
Sold by
Mills Robert J and Mills Rosalina S
Bought by
Read Terry A and Read Laura R
Home Financials for this Owner
Home Financials are based on the most recent Mortgage that was taken out on this home.
Original Mortgage
$149,200
Interest Rate
6.91%
Purchase Details
Closed on
Dec 16, 1999
Sold by
Helmes Inc
Bought by
Mills Robert J and Mills Rosalina S
Home Financials for this Owner
Home Financials are based on the most recent Mortgage that was taken out on this home.
Original Mortgage
$174,182
Interest Rate
7.69%
Mortgage Type
FHA
Create a Home Valuation Report for This Property
The Home Valuation Report is an in-depth analysis detailing your home's value as well as a comparison with similar homes in the area
Home Values in the Area
Average Home Value in this Area
Purchase History
| Date | Buyer | Sale Price | Title Company |
|---|---|---|---|
| Boles Robert | $213,500 | First American Title | |
| Read Terry A | $186,500 | First American Title Ins Co | |
| Mills Robert J | $175,742 | Chicago Title Insurance Co |
Source: Public Records
Mortgage History
| Date | Status | Borrower | Loan Amount |
|---|---|---|---|
| Open | Boles Robert | $208,087 | |
| Previous Owner | Read Terry A | $149,200 | |
| Previous Owner | Mills Robert J | $174,182 |
Source: Public Records
Tax History Compared to Growth
Tax History
| Year | Tax Paid | Tax Assessment Tax Assessment Total Assessment is a certain percentage of the fair market value that is determined by local assessors to be the total taxable value of land and additions on the property. | Land | Improvement |
|---|---|---|---|---|
| 2025 | $5,379 | $532,805 | $189,000 | $343,805 |
| 2024 | $5,287 | $531,705 | $189,000 | $342,705 |
| 2023 | $5,225 | $548,173 | $189,000 | $359,173 |
| 2022 | $4,730 | $533,356 | $182,250 | $351,106 |
| 2021 | $4,413 | $449,635 | $153,900 | $295,735 |
| 2020 | $4,425 | $394,479 | $135,000 | $259,479 |
| 2019 | $3,897 | $397,436 | $135,100 | $262,336 |
| 2018 | $4,200 | $377,723 | $0 | $0 |
| 2017 | $3,884 | $328,390 | $0 | $0 |
| 2016 | $3,673 | $316,666 | $0 | $0 |
| 2015 | $3,521 | $278,770 | $0 | $0 |
| 2014 | -- | $254,316 | $0 | $0 |
| 2013 | -- | $229,813 | $0 | $0 |
Source: Public Records
Map
Nearby Homes
- 16506 NE 13th St
- 1016 NE 163rd Ave
- 16209 NE 11th St
- 1111 NE 171st Ct
- 16115 NE 8th St
- 16500 SE 1st St
- 16500 SE 1st St Unit 14
- 16500 SE 1st St Unit 170
- 16500 SE 1st St Unit 44
- 16500 SE 1st St Unit 98
- 16500 SE 1st St Unit 144
- 16500 SE 1st St Unit 68
- 16500 SE 1st St Unit 46
- 17006 NE 6th St
- 16715 NE 5th St
- 16525 NE 20th St
- 419 NE 169th Ave
- 700 NE 173rd Ave
- 16318 NE 20th St
- 16306 NE 20th St
- 1208 NE 167th Ave
- 1118 NE 167th Ave
- 1212 NE 167th Ave
- 16700 NE 12th St
- 1215 NE 166th Ave
- 1211 NE 166th Ave
- 16703 NE 13th Cir
- 1217 NE 166th Ave
- 1207 NE 166th Ave
- 1114 NE 167th Ave
- 1302 NE 167th Ave
- 1117 NE 167th Ave
- 1219 NE 166th Ave
- 16704 NE 12th St
- 1203 NE 166th Ave
- 16707 NE 13th Cir
- 1113 NE 167th Ave
- 1201 NE 166th Ave
- 1110 NE 167th Ave
- 1306 NE 167th Ave