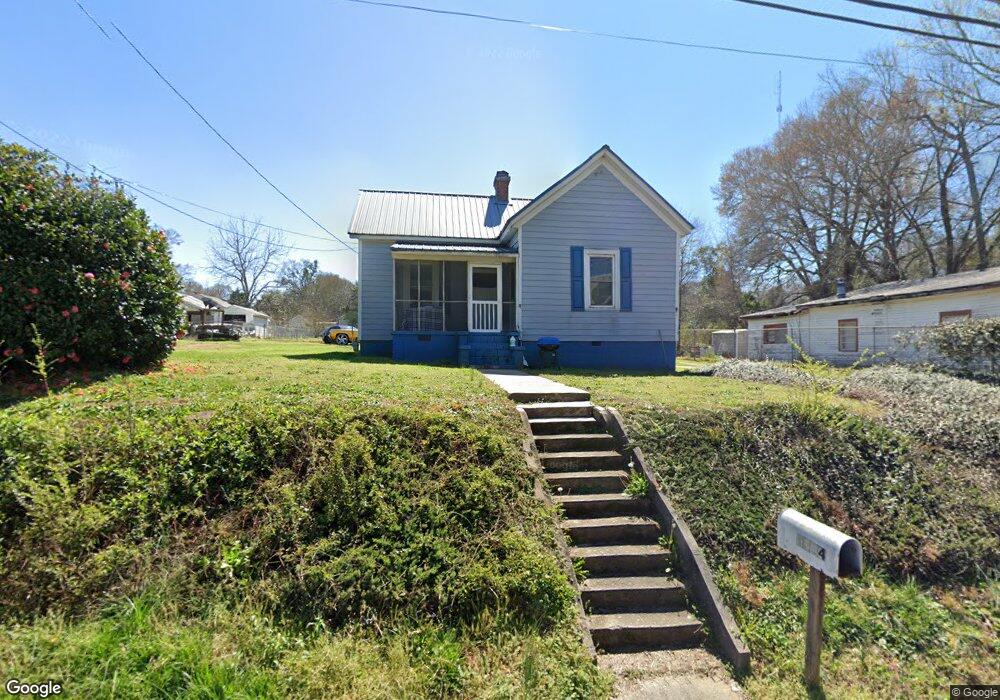
1204 Paxton St Lagrange, GA 30241
Estimated Value: $74,000 - $111,000
1
Bed
1
Bath
817
Sq Ft
$112/Sq Ft
Est. Value
About This Home
This home is located at 1204 Paxton St, Lagrange, GA 30241 and is currently estimated at $91,320, approximately $111 per square foot. 1204 Paxton St is a home located in Troup County with nearby schools including Hollis Hand Elementary School, Franklin Forest Elementary School, and Ethel W. Kight Elementary School.
Ownership History
Date
Name
Owned For
Owner Type
Purchase Details
Closed on
Feb 7, 2017
Sold by
Thomas Martha K
Bought by
Stanford Samantha
Current Estimated Value
Purchase Details
Closed on
Sep 4, 2012
Sold by
Thomas Martha K
Bought by
Thomas Martha K and King Cliff
Purchase Details
Closed on
May 1, 2012
Sold by
Thomas Martha King
Bought by
Dowdle Tony Chevez
Purchase Details
Closed on
Jul 23, 2010
Sold by
Bible Pearl Gamel
Bought by
Thomas Martha King
Purchase Details
Closed on
Feb 1, 1997
Sold by
Linda C Buttrum
Bought by
Gamel Earl D
Purchase Details
Closed on
Jan 31, 1997
Sold by
Robert Lee Buttrum By Ex
Bought by
Linda C Buttrum
Purchase Details
Closed on
May 29, 1990
Sold by
Rosa Velt Buttram
Bought by
Robert Lee Buttrum By Ex
Purchase Details
Closed on
Feb 17, 1978
Sold by
Robert Lee Buttrum Etal
Bought by
Rosa Velt Buttram
Purchase Details
Closed on
Jan 1, 1961
Sold by
Dunson Mills
Bought by
Robert Lee Buttrum Etal
Create a Home Valuation Report for This Property
The Home Valuation Report is an in-depth analysis detailing your home's value as well as a comparison with similar homes in the area
Home Values in the Area
Average Home Value in this Area
Purchase History
| Date | Buyer | Sale Price | Title Company |
|---|---|---|---|
| Stanford Samantha | $32,000 | -- | |
| Thomas Martha K | $52,318 | -- | |
| Dowdle Tony Chevez | $50,000 | -- | |
| Thomas Martha King | $15,000 | -- | |
| Gamel Earl D | $18,600 | -- | |
| Linda C Buttrum | -- | -- | |
| Robert Lee Buttrum By Ex | -- | -- | |
| Rosa Velt Buttram | -- | -- | |
| Robert Lee Buttrum Etal | -- | -- |
Source: Public Records
Tax History Compared to Growth
Tax History
| Year | Tax Paid | Tax Assessment Tax Assessment Total Assessment is a certain percentage of the fair market value that is determined by local assessors to be the total taxable value of land and additions on the property. | Land | Improvement |
|---|---|---|---|---|
| 2024 | $518 | $19,000 | $2,640 | $16,360 |
| 2023 | $405 | $14,840 | $2,640 | $12,200 |
| 2022 | $394 | $14,120 | $2,640 | $11,480 |
| 2021 | $408 | $13,520 | $2,640 | $10,880 |
| 2020 | $408 | $13,520 | $2,640 | $10,880 |
| 2019 | $376 | $12,480 | $2,640 | $9,840 |
| 2018 | $376 | $12,480 | $2,640 | $9,840 |
| 2017 | $374 | $12,390 | $2,310 | $10,080 |
| 2016 | $364 | $12,066 | $2,310 | $9,756 |
| 2015 | $330 | $10,925 | $2,678 | $8,247 |
| 2014 | $331 | $10,925 | $2,678 | $8,247 |
| 2013 | -- | $12,070 | $2,678 | $9,392 |
Source: Public Records
Map
Nearby Homes
- 15 Fulton St
- 0 E Render St
- 5 Curran Ave
- 906 Georgia Ave
- 902 Georgia Ave
- 621 Arthur St
- 117 Belk St
- 121 de Groat St
- LOT 58 Belk St
- 119 Belk St
- LOT 65 Belk St
- LOT 66 Belk St
- 208 Render St
- Coleman Plan at Crossvine Village
- 0 Mill Creek Pkwy Unit PHASE 5 10313564
- Beckman Plan at Crossvine Village
- 0 Mill Creek Pkwy Unit PHASE 4 10313585
- Fairfield Plan at Crossvine Village
- Broadmoor Plan at Crossvine Village
- Dover Plan at Crossvine Village