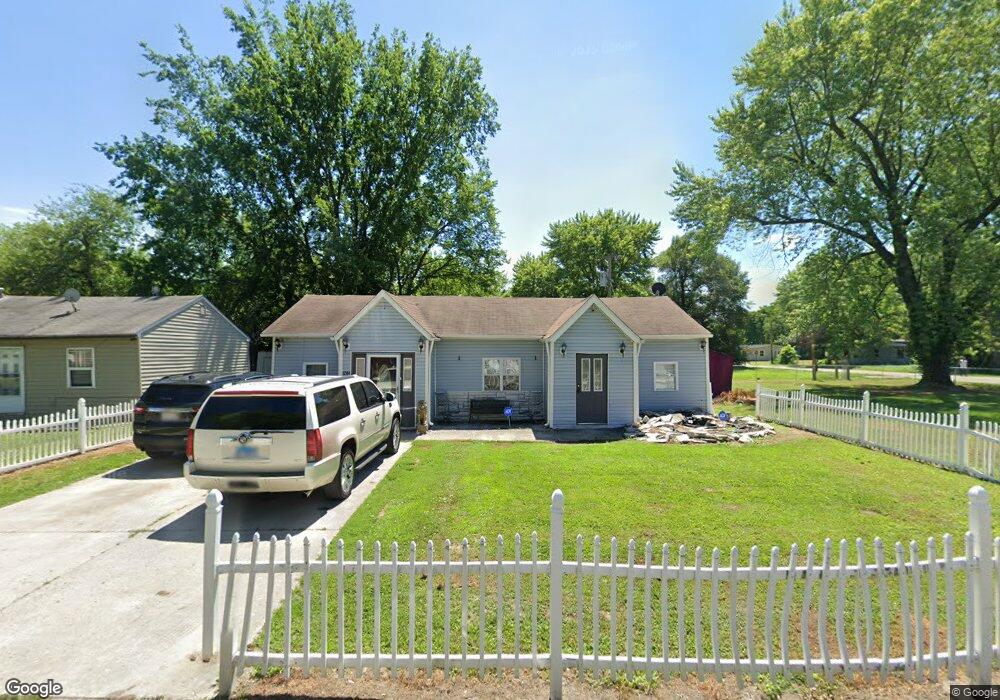
1204 Richard Dr East Saint Louis, IL 62206
Estimated Value: $68,615 - $100,000
--
Bed
--
Bath
1,032
Sq Ft
$80/Sq Ft
Est. Value
About This Home
This home is located at 1204 Richard Dr, East Saint Louis, IL 62206 and is currently estimated at $82,654, approximately $80 per square foot. 1204 Richard Dr is a home located in St. Clair County.
Ownership History
Date
Name
Owned For
Owner Type
Purchase Details
Closed on
Oct 22, 2020
Sold by
St Clair County
Bought by
Woods Raymond
Current Estimated Value
Purchase Details
Closed on
Apr 30, 2007
Sold by
Khayr Halgan
Bought by
Wilkinson Kimbra D
Home Financials for this Owner
Home Financials are based on the most recent Mortgage that was taken out on this home.
Original Mortgage
$64,800
Interest Rate
6.2%
Mortgage Type
Purchase Money Mortgage
Purchase Details
Closed on
May 11, 2006
Sold by
Willyard Carl and Willyard Diana M
Bought by
Khayr Halgan
Home Financials for this Owner
Home Financials are based on the most recent Mortgage that was taken out on this home.
Original Mortgage
$50,350
Interest Rate
6.39%
Mortgage Type
Fannie Mae Freddie Mac
Purchase Details
Closed on
Apr 7, 1997
Sold by
Brewer Calvin J and Brewer Florence E
Bought by
Willyard Carl
Create a Home Valuation Report for This Property
The Home Valuation Report is an in-depth analysis detailing your home's value as well as a comparison with similar homes in the area
Home Values in the Area
Average Home Value in this Area
Purchase History
| Date | Buyer | Sale Price | Title Company |
|---|---|---|---|
| Woods Raymond | -- | None Available | |
| Wilkinson Kimbra D | $72,000 | Metro East Title Corporation | |
| Khayr Halgan | $53,000 | Metro East Title Corporation | |
| Willyard Carl | $16,000 | Benedick Title Insurance |
Source: Public Records
Mortgage History
| Date | Status | Borrower | Loan Amount |
|---|---|---|---|
| Previous Owner | Wilkinson Kimbra D | $64,800 | |
| Previous Owner | Khayr Halgan | $50,350 |
Source: Public Records
Tax History Compared to Growth
Tax History
| Year | Tax Paid | Tax Assessment Tax Assessment Total Assessment is a certain percentage of the fair market value that is determined by local assessors to be the total taxable value of land and additions on the property. | Land | Improvement |
|---|---|---|---|---|
| 2024 | $1,050 | $11,518 | $462 | $11,056 |
| 2023 | $838 | $10,411 | $418 | $9,993 |
| 2022 | $620 | $9,124 | $366 | $8,758 |
| 2021 | $587 | $8,646 | $347 | $8,299 |
| 2020 | $637 | $8,284 | $364 | $7,920 |
| 2019 | $638 | $8,284 | $364 | $7,920 |
| 2018 | $626 | $8,405 | $369 | $8,036 |
| 2017 | $313 | $8,202 | $360 | $7,842 |
| 2016 | $634 | $8,016 | $359 | $7,657 |
| 2014 | $279 | $7,929 | $355 | $7,574 |
| 2013 | $973 | $7,437 | $333 | $7,104 |
Source: Public Records
Map
Nearby Homes
- 1124 Saint Michael Dr
- 1109 Saint Helena Dr
- 1120 Saint Michael Dr
- 1103 Saint Helena Dr
- 404 Range Ln
- 815 Sparks Ave
- 300 Saint Kevin St
- 913 Joliet Dr Unit 1
- 1402 Richard Dr
- 794 Mildred Ave
- 1157 Jones St
- 779 Mildred Ave Unit Front and Rear house
- 804 Otto St
- 768 Leon St
- 801 Preston Ln
- 1426 Richard Dr
- 1106 Saint Boniface Dr
- 1159 Smith St
- 1128 Saint Benedict Dr
- 713 Mildred Ave
- 1206 Richard Dr
- 1202 Richard Dr
- 1203 Saint Stephens Dr
- 1208 Richard Dr
- 1205 Saint Stephens Dr
- 1207 Saint Stephens Dr
- 1207 St Stephens Dr
- 1203 Richard Dr
- 1210 Richard Dr
- 1205 Richard Dr
- 1201 Richard Dr
- 1120 Richard Dr
- 1209 Saint Stephens Dr
- 1207 Richard Dr
- 1135 St Stephens Dr
- 1135 St Stephen Dr
- 1211 Saint Stephens Dr
- 1212 Richard Dr
- 1209 Richard Dr
- 1118 Richard Dr