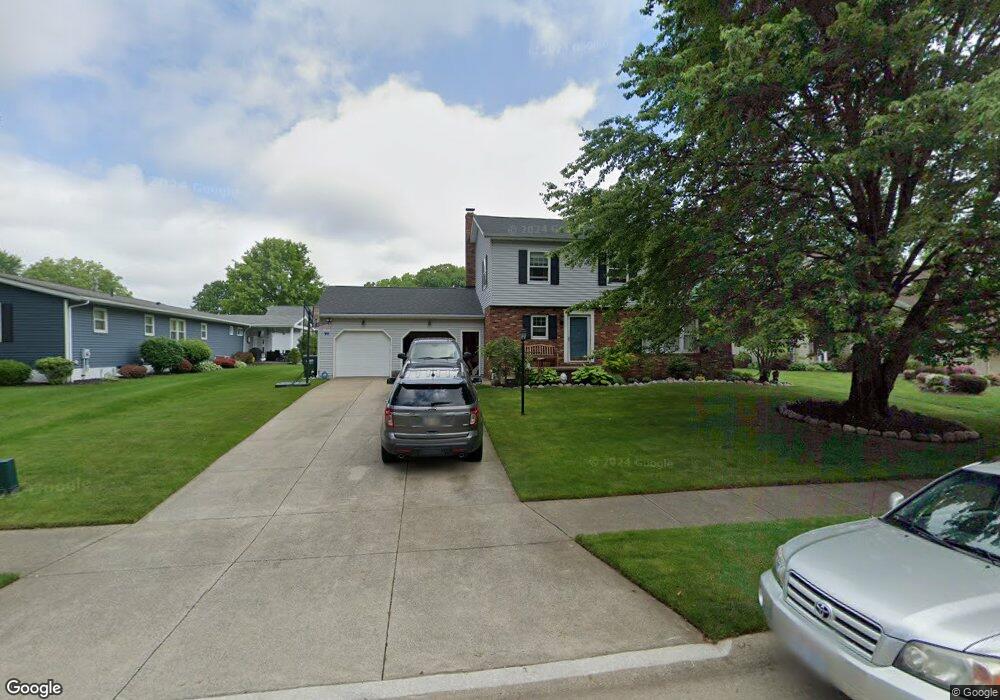
1204 S Azalea Blvd Barberton, OH 44203
East Barberton NeighborhoodEstimated Value: $282,000 - $311,000
4
Beds
3
Baths
1,872
Sq Ft
$156/Sq Ft
Est. Value
About This Home
This home is located at 1204 S Azalea Blvd, Barberton, OH 44203 and is currently estimated at $292,908, approximately $156 per square foot. 1204 S Azalea Blvd is a home located in Summit County with nearby schools including Barberton Intermediate School 3-5, Barberton Middle School, and Barberton High School.
Ownership History
Date
Name
Owned For
Owner Type
Purchase Details
Closed on
Sep 15, 2014
Sold by
Cameron Dale E
Bought by
White Christopher M and White Sally K
Current Estimated Value
Home Financials for this Owner
Home Financials are based on the most recent Mortgage that was taken out on this home.
Original Mortgage
$130,000
Outstanding Balance
$99,413
Interest Rate
4.11%
Mortgage Type
New Conventional
Estimated Equity
$193,495
Purchase Details
Closed on
Oct 15, 1997
Sold by
Arnold G Yost Trst
Bought by
Cameron Dale E and Cameron Marygrace
Purchase Details
Closed on
Dec 26, 1996
Sold by
Evelyn J Taracuk Trst
Bought by
Arnold G Yost Trustee
Home Financials for this Owner
Home Financials are based on the most recent Mortgage that was taken out on this home.
Original Mortgage
$123,720
Interest Rate
7.64%
Mortgage Type
New Conventional
Create a Home Valuation Report for This Property
The Home Valuation Report is an in-depth analysis detailing your home's value as well as a comparison with similar homes in the area
Home Values in the Area
Average Home Value in this Area
Purchase History
| Date | Buyer | Sale Price | Title Company |
|---|---|---|---|
| White Christopher M | $145,000 | None Available | |
| Cameron Dale E | $138,000 | -- | |
| Arnold G Yost Trustee | $132,000 | -- |
Source: Public Records
Mortgage History
| Date | Status | Borrower | Loan Amount |
|---|---|---|---|
| Open | White Christopher M | $130,000 | |
| Previous Owner | Arnold G Yost Trustee | $123,720 |
Source: Public Records
Tax History Compared to Growth
Tax History
| Year | Tax Paid | Tax Assessment Tax Assessment Total Assessment is a certain percentage of the fair market value that is determined by local assessors to be the total taxable value of land and additions on the property. | Land | Improvement |
|---|---|---|---|---|
| 2025 | $3,607 | $72,104 | $14,385 | $57,719 |
| 2024 | $3,607 | $72,104 | $14,385 | $57,719 |
| 2023 | $3,607 | $72,104 | $14,385 | $57,719 |
| 2022 | $3,142 | $54,394 | $10,815 | $43,579 |
| 2021 | $3,139 | $54,394 | $10,815 | $43,579 |
| 2020 | $3,072 | $54,400 | $10,820 | $43,580 |
| 2019 | $3,415 | $54,780 | $11,530 | $43,250 |
| 2018 | $3,363 | $54,780 | $11,530 | $43,250 |
| 2017 | $3,024 | $54,780 | $11,530 | $43,250 |
| 2016 | $3,031 | $48,620 | $11,530 | $37,090 |
| 2015 | $3,024 | $48,620 | $11,530 | $37,090 |
| 2014 | $3,008 | $48,620 | $11,530 | $37,090 |
| 2013 | $2,957 | $49,470 | $11,530 | $37,940 |
Source: Public Records
Map
Nearby Homes
- 369 Big Bend Cir
- 579 Glenmere Place
- 588 Austin Dr
- 311 Holly Place
- 986 S Azalea Blvd
- 1110 Mansion Dr
- 303 Spruce St
- 251 Slate Ridge Dr
- 861 Wisteria Dr
- 315 Kreider Ave
- 477 Robinson Ave
- 901 Robinson Ave
- 1742 Turkeyfoot Lake Rd
- 327 Robinson Ave
- 713 E State St
- 360 E Tuscarawas Ave
- 283 Haven Ave
- 334 E Tuscarawas Ave
- 3539 Potts Dr
- 649 E Hopocan Ave
- 1198 S Azalea Blvd
- 305 Shenandoah Blvd
- 293 Shenandoah Blvd
- 1190 S Azalea Blvd
- 1207 S Azalea Blvd
- 285 Shenandoah Blvd
- 304 Shenandoah Blvd
- 1184 S Azalea Blvd
- 1197 S Azalea Blvd
- 331 Shenandoah Blvd
- 608 Anna Dean Ln
- 612 Anna Dean Ln
- 1191 S Azalea Blvd
- 275 Shenandoah Blvd
- 322 Shenandoah Blvd
- 1176 S Azalea Blvd
- 1240 S Azalea Blvd
- 1183 S Azalea Blvd
- 292 Shenandoah Blvd
- 339 Shenandoah Blvd