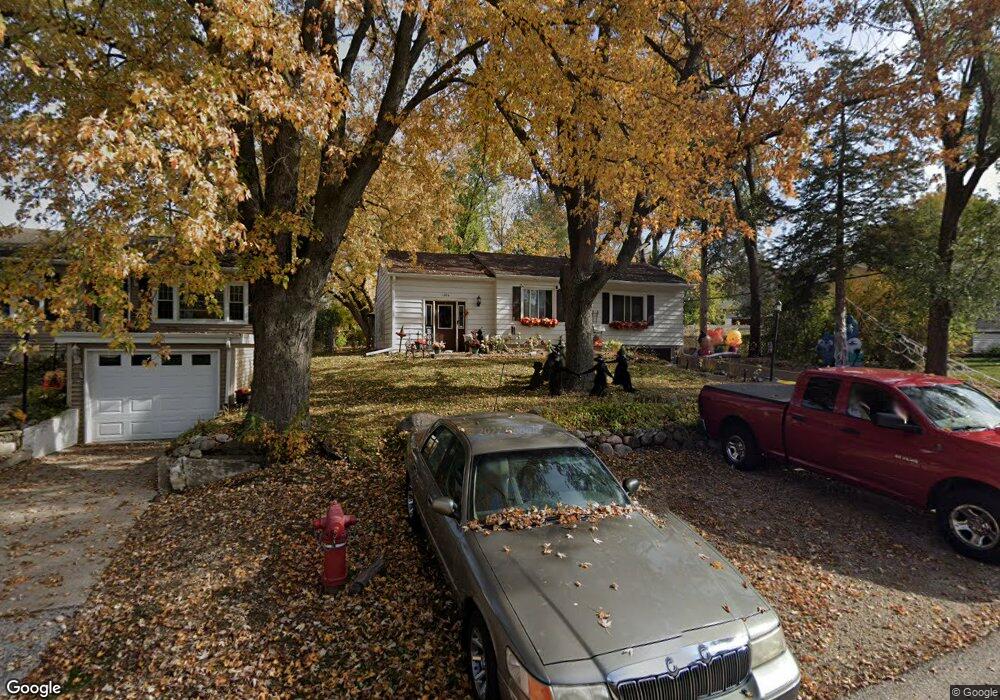
1204 Sycamore St Lake In the Hills, IL 60156
Estimated Value: $280,746 - $309,000
3
Beds
2
Baths
1,106
Sq Ft
$266/Sq Ft
Est. Value
About This Home
This home is located at 1204 Sycamore St, Lake In the Hills, IL 60156 and is currently estimated at $294,687, approximately $266 per square foot. 1204 Sycamore St is a home located in McHenry County with nearby schools including Westfield Community School, Lake in the Hills Elementary School, and Harry D Jacobs High School.
Ownership History
Date
Name
Owned For
Owner Type
Purchase Details
Closed on
Jul 30, 2007
Sold by
Seeman Bradley N and Seeman Kiersten S
Bought by
Maranda Derek R and Maranda Kim L
Current Estimated Value
Home Financials for this Owner
Home Financials are based on the most recent Mortgage that was taken out on this home.
Original Mortgage
$198,000
Outstanding Balance
$125,556
Interest Rate
6.69%
Mortgage Type
Unknown
Estimated Equity
$169,131
Purchase Details
Closed on
May 21, 1999
Sold by
Rogers George and Rogers Barbara
Bought by
Seeman Bradley N and Seeman Kiersten S
Home Financials for this Owner
Home Financials are based on the most recent Mortgage that was taken out on this home.
Original Mortgage
$90,000
Interest Rate
6.99%
Create a Home Valuation Report for This Property
The Home Valuation Report is an in-depth analysis detailing your home's value as well as a comparison with similar homes in the area
Home Values in the Area
Average Home Value in this Area
Purchase History
| Date | Buyer | Sale Price | Title Company |
|---|---|---|---|
| Maranda Derek R | $198,000 | Pntn | |
| Seeman Bradley N | $117,000 | -- |
Source: Public Records
Mortgage History
| Date | Status | Borrower | Loan Amount |
|---|---|---|---|
| Open | Maranda Derek R | $198,000 | |
| Previous Owner | Seeman Bradley N | $90,000 |
Source: Public Records
Tax History Compared to Growth
Tax History
| Year | Tax Paid | Tax Assessment Tax Assessment Total Assessment is a certain percentage of the fair market value that is determined by local assessors to be the total taxable value of land and additions on the property. | Land | Improvement |
|---|---|---|---|---|
| 2024 | $5,795 | $81,169 | $10,035 | $71,134 |
| 2023 | $5,490 | $72,595 | $8,975 | $63,620 |
| 2022 | $4,600 | $58,508 | $8,100 | $50,408 |
| 2021 | $4,406 | $54,507 | $7,546 | $46,961 |
| 2020 | $4,288 | $52,578 | $7,279 | $45,299 |
| 2019 | $4,178 | $50,324 | $6,967 | $43,357 |
| 2018 | $3,316 | $39,761 | $13,927 | $25,834 |
| 2017 | $3,230 | $37,457 | $13,120 | $24,337 |
| 2016 | $3,159 | $35,131 | $12,305 | $22,826 |
| 2013 | -- | $40,263 | $11,479 | $28,784 |
Source: Public Records
Map
Nearby Homes
- 1114 Ash St
- 275 Indian Trail
- 70 Hilltop Dr Unit 4
- 10 Lincoln St
- 215 Indian Trail
- 116 Woody Way
- 212 Village Creek Dr
- 113 Pheasant Trail
- 1345 Cunat Ct Unit 1B
- 1345 Cunat Ct Unit 2D
- 101 Oakleaf Rd
- 992 Mcphee Dr
- 1354 Cunat Ct Unit 3G
- Lots 10 & 11 Ramble Rd
- 338 Hiawatha Dr
- LOT 3 Blackhawk Dr
- 1183 Moonstone Run
- 135 Arquilla Dr
- 528 Penny Ln
- 900 Windstone Ct
- 1206 Sycamore St
- 1202 Sycamore St
- 203 E Oak St
- 1208 Sycamore St
- 1203 Birch St
- 205 E Oak St
- 1205 Birch St
- 1210 Sycamore St
- 1207 Birch St
- 115 E Oak St
- 1203 Sycamore St
- 1201 Birch St
- 1205 Sycamore St
- 1209 Birch St
- 1207 Sycamore St
- 1212 Sycamore St Unit 6
- 113 E Oak St
- 1209 Sycamore St
- 1211 Birch St
- 1214 Sycamore St