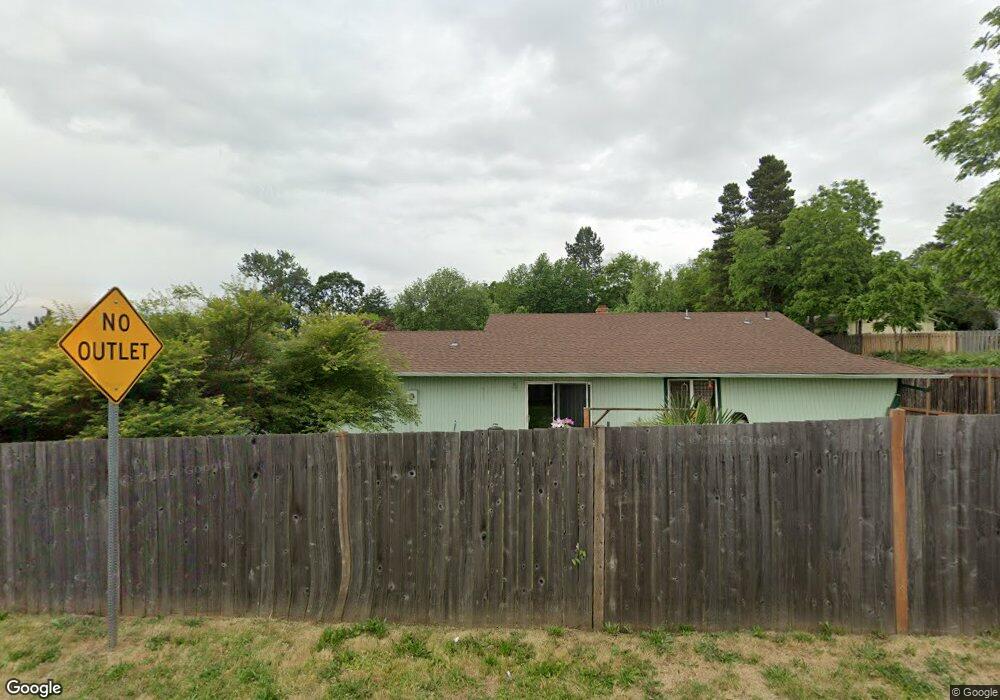
1204 W 36th St Vancouver, WA 98660
Lincoln NeighborhoodEstimated Value: $431,000 - $521,000
3
Beds
2
Baths
1,326
Sq Ft
$348/Sq Ft
Est. Value
About This Home
This home is located at 1204 W 36th St, Vancouver, WA 98660 and is currently estimated at $461,867, approximately $348 per square foot. 1204 W 36th St is a home located in Clark County with nearby schools including Lincoln Elementary School, Discovery Middle School, and Hudson's Bay High School.
Ownership History
Date
Name
Owned For
Owner Type
Purchase Details
Closed on
Jun 24, 2004
Sold by
Mcintosh Ian S and Mcintosh Stacy N
Bought by
Sayers Susan M
Current Estimated Value
Home Financials for this Owner
Home Financials are based on the most recent Mortgage that was taken out on this home.
Original Mortgage
$112,850
Outstanding Balance
$53,307
Interest Rate
5.5%
Mortgage Type
Unknown
Estimated Equity
$408,560
Purchase Details
Closed on
Jun 17, 2004
Sold by
Sayers Edward Brian
Bought by
Sayers Susan M
Home Financials for this Owner
Home Financials are based on the most recent Mortgage that was taken out on this home.
Original Mortgage
$112,850
Outstanding Balance
$53,307
Interest Rate
5.5%
Mortgage Type
Unknown
Estimated Equity
$408,560
Purchase Details
Closed on
Mar 26, 2002
Sold by
Merrill Eric and Anderson Leta
Bought by
Merrill Eric and Merrill Christa A
Home Financials for this Owner
Home Financials are based on the most recent Mortgage that was taken out on this home.
Original Mortgage
$56,500
Interest Rate
6.84%
Create a Home Valuation Report for This Property
The Home Valuation Report is an in-depth analysis detailing your home's value as well as a comparison with similar homes in the area
Home Values in the Area
Average Home Value in this Area
Purchase History
| Date | Buyer | Sale Price | Title Company |
|---|---|---|---|
| Sayers Susan M | $141,100 | First American Title | |
| Sayers Susan M | -- | First American Title | |
| Merrill Eric | -- | Chicago Title Insurance |
Source: Public Records
Mortgage History
| Date | Status | Borrower | Loan Amount |
|---|---|---|---|
| Open | Sayers Susan M | $112,850 | |
| Previous Owner | Merrill Eric | $56,500 | |
| Closed | Sayers Susan M | $28,250 |
Source: Public Records
Tax History Compared to Growth
Tax History
| Year | Tax Paid | Tax Assessment Tax Assessment Total Assessment is a certain percentage of the fair market value that is determined by local assessors to be the total taxable value of land and additions on the property. | Land | Improvement |
|---|---|---|---|---|
| 2025 | $3,866 | $386,833 | $178,538 | $208,295 |
| 2024 | $3,644 | $395,671 | $178,538 | $217,133 |
| 2023 | $3,652 | $389,347 | $178,538 | $210,809 |
| 2022 | $3,352 | $391,837 | $178,538 | $213,299 |
| 2021 | $3,207 | $335,018 | $155,250 | $179,768 |
| 2020 | $2,947 | $302,177 | $128,750 | $173,427 |
| 2019 | $794 | $287,730 | $121,214 | $166,516 |
| 2018 | $2,718 | $276,294 | $0 | $0 |
| 2017 | $2,347 | $228,134 | $0 | $0 |
| 2016 | $2,023 | $205,545 | $0 | $0 |
| 2015 | $1,889 | $169,286 | $0 | $0 |
| 2014 | -- | $149,452 | $0 | $0 |
| 2013 | -- | $135,930 | $0 | $0 |
Source: Public Records
Map
Nearby Homes
- 3811 Rose Ct
- 3815 Rose Ct
- 1115 W 33rd Way
- 3711 Thompson Ave
- 3600 Thompson Ave
- 615 W 39th St
- 4005 NW Grant St
- 1106 W 30th St
- 1014 NW 45th St
- 501 W 30th St
- 220 W 36th St
- 3403 Xavier Ave
- 109 NW 40th St
- 708 W Fourth Plain Blvd
- 2413 Markle Ave
- 610 W Fourth Plain Blvd
- 610 W Fourth Plain Blvd Unit A
- 709 W Fourth Plain Blvd
- 4900 NW Cherry St
- 118 E 36th St
- 1204 W 36th St Unit E
- 1204 W 36th St Unit B
- 1204 W 36th St Unit F
- 1204 W 36th St
- 1204 W 36th St
- 1204 W 36th St Unit A
- 3615 W Rose St
- 3623 W Rose St
- 3606 Lincoln Ave Unit G
- 3606 Lincoln Ave
- 3606 Lincoln Ave Unit C
- 3606 Lincoln Ave
- 1212 W 36th St
- 1212 W 36th St Unit C1
- 1212 W 36th St Unit D
- 1212 W 36th St
- 1212 W 36th St Unit B
- 1212 W 36th St Unit F
- 1212 W 36th St Unit A
- 1204 NW 36th St #F