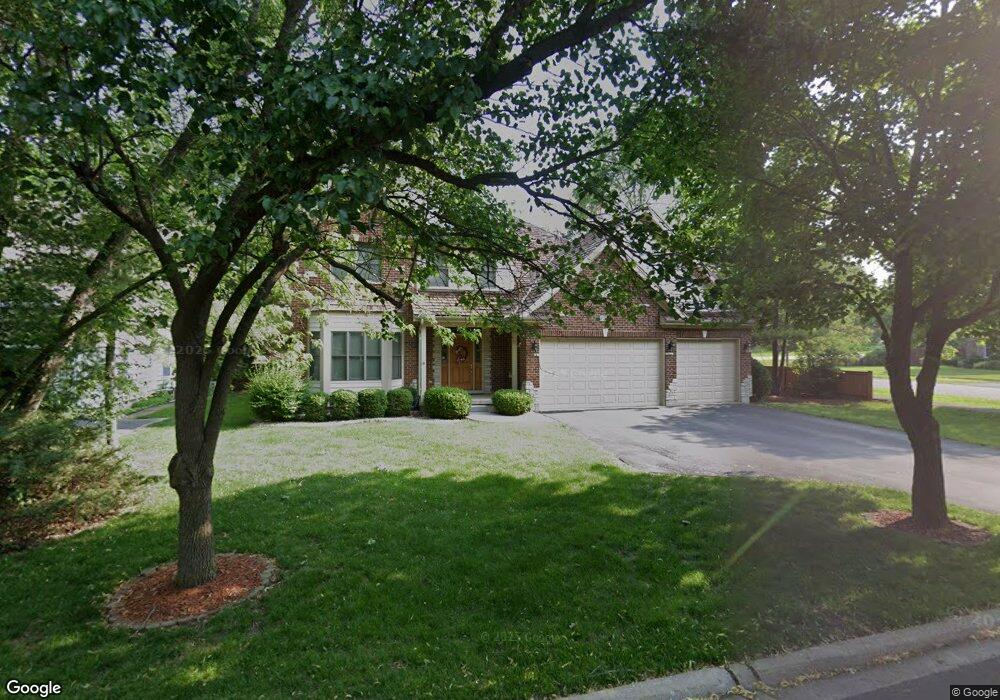
1204 W Groh Ct Palatine, IL 60067
Plum Grove Village NeighborhoodEstimated Value: $776,258 - $879,000
4
Beds
4
Baths
3,325
Sq Ft
$253/Sq Ft
Est. Value
About This Home
This home is located at 1204 W Groh Ct, Palatine, IL 60067 and is currently estimated at $842,086, approximately $253 per square foot. 1204 W Groh Ct is a home located in Cook County with nearby schools including Thomas Jefferson Elementary School, Marion Jordan Elementary School, and Walter R. Sundling Junior High School.
Ownership History
Date
Name
Owned For
Owner Type
Purchase Details
Closed on
Oct 12, 2012
Sold by
Moran Daniel S and Moran Sheila M
Bought by
Moran Shiela M and Shiela M Moran Trust
Current Estimated Value
Purchase Details
Closed on
Apr 28, 2006
Sold by
Bci Construction Inc
Bought by
Moran Daniel and Moran Sheila
Home Financials for this Owner
Home Financials are based on the most recent Mortgage that was taken out on this home.
Original Mortgage
$432,000
Outstanding Balance
$252,194
Interest Rate
6.54%
Mortgage Type
Fannie Mae Freddie Mac
Estimated Equity
$589,892
Purchase Details
Closed on
May 20, 2004
Sold by
Chapman Alice K
Bought by
Bci Construction Inc
Purchase Details
Closed on
Oct 16, 2000
Sold by
Groh Thomas J and Groh Ilona
Bought by
Chapman Alice K and The Alice K Chapman Trust
Create a Home Valuation Report for This Property
The Home Valuation Report is an in-depth analysis detailing your home's value as well as a comparison with similar homes in the area
Home Values in the Area
Average Home Value in this Area
Purchase History
| Date | Buyer | Sale Price | Title Company |
|---|---|---|---|
| Moran Shiela M | -- | None Available | |
| Moran Daniel | $682,500 | Ticor Title Insurance Compan | |
| Bci Construction Inc | $186,000 | Pntn | |
| Chapman Alice K | $163,000 | -- |
Source: Public Records
Mortgage History
| Date | Status | Borrower | Loan Amount |
|---|---|---|---|
| Open | Moran Daniel | $432,000 |
Source: Public Records
Tax History Compared to Growth
Tax History
| Year | Tax Paid | Tax Assessment Tax Assessment Total Assessment is a certain percentage of the fair market value that is determined by local assessors to be the total taxable value of land and additions on the property. | Land | Improvement |
|---|---|---|---|---|
| 2024 | $13,080 | $47,497 | $9,027 | $38,470 |
| 2023 | $13,622 | $47,497 | $9,027 | $38,470 |
| 2022 | $13,622 | $50,982 | $9,027 | $41,955 |
| 2021 | $12,905 | $43,067 | $6,018 | $37,049 |
| 2020 | $12,786 | $43,067 | $6,018 | $37,049 |
| 2019 | $12,710 | $47,747 | $6,018 | $41,729 |
| 2018 | $14,338 | $49,572 | $5,516 | $44,056 |
| 2017 | $14,085 | $49,572 | $5,516 | $44,056 |
| 2016 | $15,941 | $58,716 | $5,516 | $53,200 |
| 2015 | $13,301 | $45,913 | $5,015 | $40,898 |
| 2014 | $14,548 | $50,501 | $5,015 | $45,486 |
| 2013 | $15,555 | $55,223 | $5,015 | $50,208 |
Source: Public Records
Map
Nearby Homes
- 1120 W Wilson St
- 43 Ravenscraig Ln Unit 34
- 105 Craigie Ln Unit 22
- 260 N Clyde Ave
- 886 W Palatine Rd
- 112 Kilchurn Ln Unit 94
- 155 Burleigh Ln Unit 66
- 167 Tantallon Ln Unit 117
- 951 W Willow St
- 185 Barra Ln Unit 158
- 335 S Crescent Ave
- 836 W Dorchester Rd
- 834 W Dorchester Rd
- 354 Grayfriars Ln
- 77 N Quentin Rd Unit 202
- 1596 W Palatine Rd
- 110 Inverway
- 192 Glamis Ln Unit 131
- Lot 2, Nessie's Grov Aldridge Ave
- 824 W Dorset Ave
- 1212 W Groh Ct
- 1223 W Groh Ct
- 1207 W Groh Ct
- 1220 W Groh Ct
- 1215 W Groh Ct
- 1228 W Groh Ct
- 1229 W Groh Ct
- 1190 W Kraml Ct
- 1151 W Palatine Rd
- 1206 W Palatine Rd
- 1277 W Palatine Rd
- 1235 W Groh Ct
- 1200 W Palatine Rd
- 1241 W Groh Ct
- 1180 W Kraml Ct
- 1253 W Groh Ct
- 1191 W Kraml Ct
- 1176 W Palatine Rd
- 1247 W Groh Ct
- 1129 W Palatine Rd