12040 Dancliff Trace Unit 12040 Alpharetta, GA 30009
Estimated Value: $701,000 - $762,086
3
Beds
4
Baths
1,952
Sq Ft
$378/Sq Ft
Est. Value
About This Home
This home is located at 12040 Dancliff Trace Unit 12040, Alpharetta, GA 30009 and is currently estimated at $737,522, approximately $377 per square foot. 12040 Dancliff Trace Unit 12040 is a home located in Fulton County with nearby schools including Manning Oaks Elementary School, Hopewell Middle School, and Alpharetta High School.
Ownership History
Date
Name
Owned For
Owner Type
Purchase Details
Closed on
Jul 16, 2009
Sold by
Wiles Ron G
Bought by
Sigg Stefan G and Sigg Sharon B
Current Estimated Value
Purchase Details
Closed on
Sep 12, 2008
Sold by
Edwards Matthew J and Edwards Amy P
Bought by
Wiles Ron G and Crosby Rhonda
Home Financials for this Owner
Home Financials are based on the most recent Mortgage that was taken out on this home.
Original Mortgage
$296,380
Interest Rate
6.49%
Mortgage Type
VA
Purchase Details
Closed on
Feb 7, 2006
Sold by
Hms John Wieland and Hms Neighborhoo
Bought by
Academy Park Neighborhood Assn
Purchase Details
Closed on
Jan 31, 2002
Sold by
John Wieland Homes & Neighb
Bought by
Edwards Amy P and Edwards Matthew J
Home Financials for this Owner
Home Financials are based on the most recent Mortgage that was taken out on this home.
Original Mortgage
$252,240
Interest Rate
5.88%
Mortgage Type
New Conventional
Create a Home Valuation Report for This Property
The Home Valuation Report is an in-depth analysis detailing your home's value as well as a comparison with similar homes in the area
Home Values in the Area
Average Home Value in this Area
Purchase History
| Date | Buyer | Sale Price | Title Company |
|---|---|---|---|
| Sigg Stefan G | $282,000 | -- | |
| Wiles Ron G | $290,000 | -- | |
| Academy Park Neighborhood Assn | -- | -- | |
| Edwards Amy P | $280,300 | -- |
Source: Public Records
Mortgage History
| Date | Status | Borrower | Loan Amount |
|---|---|---|---|
| Previous Owner | Wiles Ron G | $296,380 | |
| Previous Owner | Edwards Amy P | $252,240 |
Source: Public Records
Tax History Compared to Growth
Tax History
| Year | Tax Paid | Tax Assessment Tax Assessment Total Assessment is a certain percentage of the fair market value that is determined by local assessors to be the total taxable value of land and additions on the property. | Land | Improvement |
|---|---|---|---|---|
| 2025 | $1,529 | $265,960 | $41,880 | $224,080 |
| 2023 | $6,434 | $227,960 | $35,520 | $192,440 |
| 2022 | $5,547 | $196,520 | $27,240 | $169,280 |
| 2021 | $5,186 | $157,720 | $30,760 | $126,960 |
| 2020 | $5,481 | $163,400 | $35,040 | $128,360 |
| 2019 | $800 | $139,200 | $6,280 | $132,920 |
| 2018 | $3,619 | $128,200 | $15,320 | $112,880 |
| 2017 | $3,299 | $113,080 | $11,760 | $101,320 |
| 2016 | $3,300 | $113,080 | $11,760 | $101,320 |
| 2015 | $3,964 | $113,080 | $11,760 | $101,320 |
| 2014 | $3,466 | $113,080 | $11,760 | $101,320 |
Source: Public Records
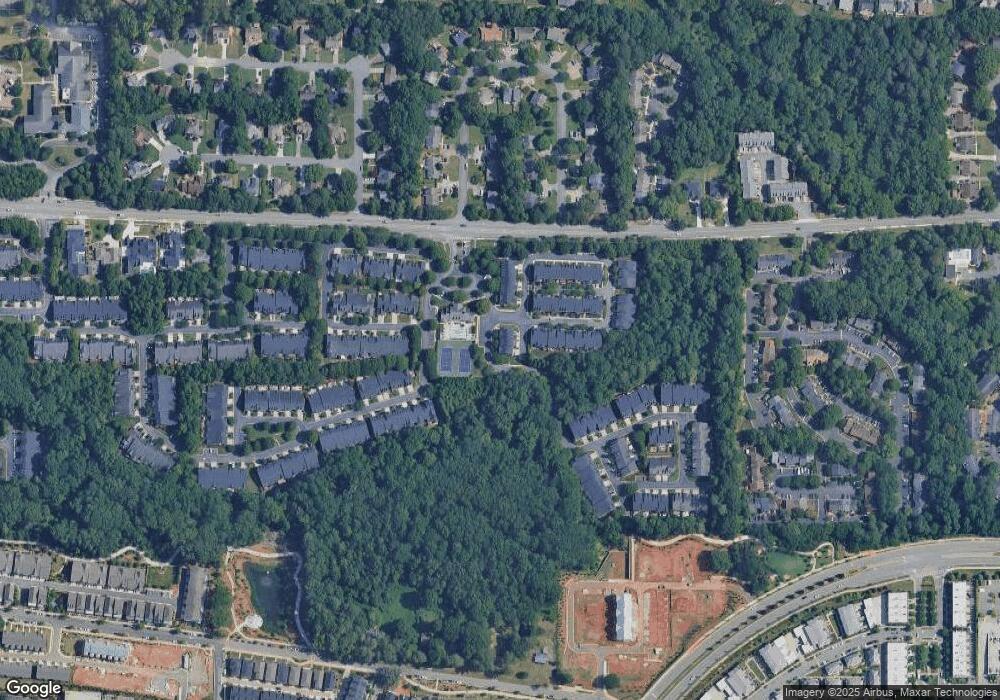
Map
Nearby Homes
- 12120 Dancliff Trace
- 2555 Milford Ln
- 2540 Milford Ln
- 11715 Dancliff Trace
- 2600 Milford Ln
- 272 Thompson St
- 276 Thompson St
- 11945 Dancliff Trace
- 11750 Dancliff Trace
- 205 Chiswick Cir
- 221 Academy St
- 415 Chiswick Cir
- 415 Chiswick Cir Unit 23
- 435 Chiswick Cir
- 435 Chiswick Cir Unit 21
- 376 Concord St
- 293 Thompson St
- 550 Fisher Dr Unit 47
- 12030 Dancliff Trace
- 12030 Dancliff Trace Unit 12030
- 12050 Dancliff Trace
- 2505 Milford Ln
- 12060 Dancliff Trace Unit 12060
- 2515 Milford Ln
- 0 Milford Ln
- 2500 Milford Ln
- 2525 Milford Ln
- 12070 Dancliff Trace
- 2510 Milford Ln
- 2535 Milford Ln Unit 2535
- 12080 Dancliff Trace
- 12080 Dancliff Trace Unit 12080
- 2520 Milford Ln
- 2545 Milford Ln
- 2530 Milford Ln Unit 2530
- 12090 Dancliff Trace
- 2540 Milford Ln Unit 2540
- 12100 Dancliff Trace