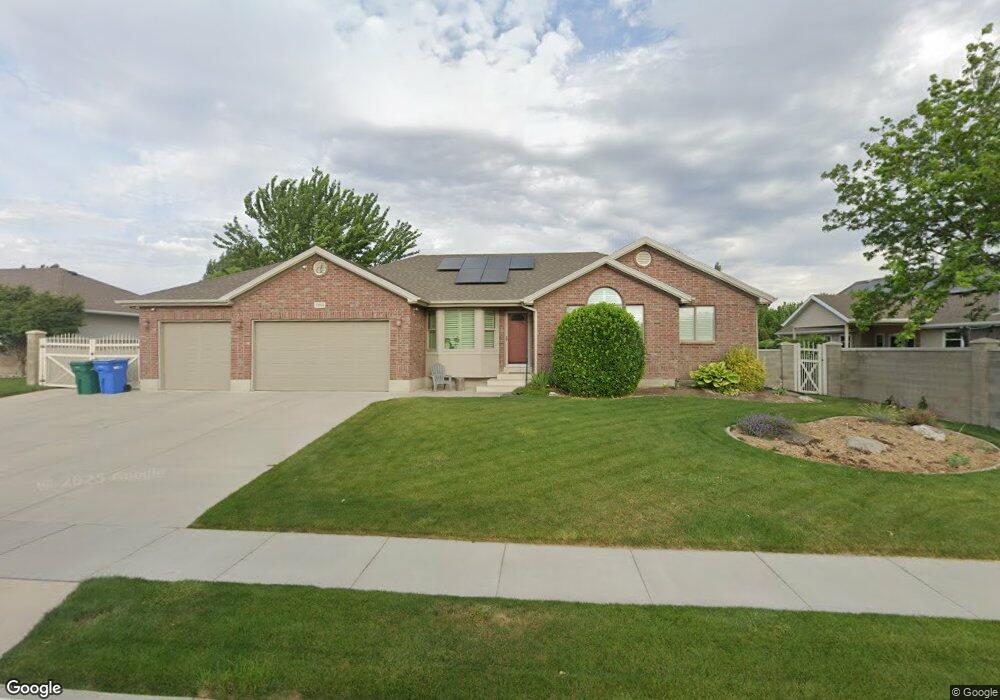
12044 Park Haven Ln Riverton, UT 84096
Estimated Value: $578,000 - $717,000
3
Beds
2
Baths
3,024
Sq Ft
$215/Sq Ft
Est. Value
About This Home
This home is located at 12044 Park Haven Ln, Riverton, UT 84096 and is currently estimated at $651,076, approximately $215 per square foot. 12044 Park Haven Ln is a home located in Salt Lake County with nearby schools including Midas Creek Elementary School, Oquirrh Hills Middle School, and Riverton High School.
Ownership History
Date
Name
Owned For
Owner Type
Purchase Details
Closed on
Jun 24, 2024
Sold by
Glad Janet Kay
Bought by
Janet Kay Glad Revocable Living Trust and Glad
Current Estimated Value
Purchase Details
Closed on
Oct 14, 2005
Sold by
Anderson Gordon L and Anderson Barbara J
Bought by
Glad Janet K
Home Financials for this Owner
Home Financials are based on the most recent Mortgage that was taken out on this home.
Original Mortgage
$229,000
Interest Rate
5.63%
Mortgage Type
Purchase Money Mortgage
Purchase Details
Closed on
Aug 22, 2001
Sold by
Tim Jenson Construction Corp
Bought by
Anderson Gordon L and Anderson Barbara J
Home Financials for this Owner
Home Financials are based on the most recent Mortgage that was taken out on this home.
Original Mortgage
$199,400
Interest Rate
9.99%
Purchase Details
Closed on
Mar 21, 2001
Sold by
Park Haven Realty Holdings Llc
Bought by
Tim Jenson Construction Corp
Create a Home Valuation Report for This Property
The Home Valuation Report is an in-depth analysis detailing your home's value as well as a comparison with similar homes in the area
Home Values in the Area
Average Home Value in this Area
Purchase History
| Date | Buyer | Sale Price | Title Company |
|---|---|---|---|
| Janet Kay Glad Revocable Living Trust | -- | None Listed On Document | |
| Glad Janet K | -- | Surety Title | |
| Anderson Gordon L | -- | First American Title Ins | |
| Tim Jenson Construction Corp | -- | Merrill Title |
Source: Public Records
Mortgage History
| Date | Status | Borrower | Loan Amount |
|---|---|---|---|
| Previous Owner | Glad Janet K | $229,000 | |
| Previous Owner | Anderson Gordon L | $199,400 |
Source: Public Records
Tax History Compared to Growth
Tax History
| Year | Tax Paid | Tax Assessment Tax Assessment Total Assessment is a certain percentage of the fair market value that is determined by local assessors to be the total taxable value of land and additions on the property. | Land | Improvement |
|---|---|---|---|---|
| 2025 | -- | $596,600 | $184,100 | $412,500 |
| 2024 | -- | $579,200 | $178,600 | $400,600 |
| 2023 | $3,442 | $561,600 | $173,400 | $388,200 |
| 2022 | $3,574 | $572,100 | $170,000 | $402,100 |
| 2021 | $4,014 | $428,900 | $130,300 | $298,600 |
| 2020 | $2,796 | $371,500 | $130,300 | $241,200 |
| 2019 | $2,757 | $360,100 | $122,900 | $237,200 |
| 2018 | $2,623 | $337,300 | $122,900 | $214,400 |
| 2017 | $2,523 | $316,200 | $122,900 | $193,300 |
| 2016 | $2,531 | $304,400 | $122,900 | $181,500 |
| 2015 | $2,645 | $308,400 | $131,000 | $177,400 |
| 2014 | $2,435 | $278,400 | $119,300 | $159,100 |
Source: Public Records
Map
Nearby Homes
- 12667 S Lincoln Peak Ln Unit 132
- 12667 S Lincoln Peak Ln Unit 125
- 12667 S Lincoln Peak Ln
- 12671 S Lincoln Peak Ln Unit 131
- 12671 S Lincoln Peak Ln
- 12687 S Lincoln Peak Ln Unit 126
- 12687 S Lincoln Peak Ln
- 12693 S Lincoln Peak Ln
- 12668 S Lincoln Peak Ln Unit 109
- 12674 S Lincoln Peak Ln
- 12674 S Lincoln Peak Ln Unit 111
- 12676 S Lincoln Peak Ln
- 12676 S Lincoln Peak Ln Unit 112
- 12682 S Lincoln Peak Ln
- 12682 S Lincoln Peak Ln Unit 113
- 12686 Lincoln Peak Ln
- 12688 S Lincoln Peak Ln Unit 115
- 12688 S Lincoln Peak Ln
- 12694 S Lincoln Peak Ln Unit 116
- 12694 S Lincoln Peak Ln
- 4493 W Park Hollow Ln
- 4493 Park Hollow Ln
- 12058 Park Haven Ln
- 4483 W Park Hollow Ln
- 4483 Park Hollow Ln
- 4507 W Park Hollow Ln
- 12115 S Midas Park Rd
- 12049 Park Haven Ln
- 12049 S Park Haven Ln
- 12037 Park Haven Ln
- 4478 Spring Park Cir
- 4478 W Spring Park Cir
- 4484 Spring Park Cir
- 4486 Spring Park Cir
- 12063 Park Haven Ln
- 4488 Spring Park Cir
- 4488 W Spring Park Cir
- 4467 Park Haven Ln Unit 154
- 12023 Park Haven Ln
- 4502 Spring Park Cir