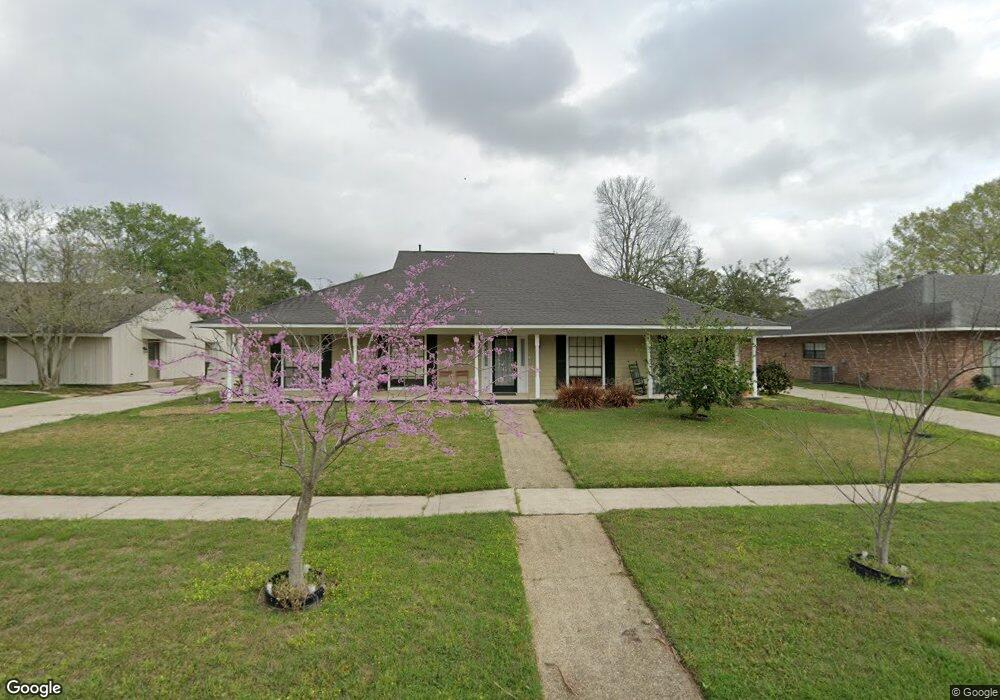
12047 Oak Haven Ave Baton Rouge, LA 70810
Oak Hills Place NeighborhoodEstimated Value: $355,792 - $421,000
4
Beds
3
Baths
2,555
Sq Ft
$154/Sq Ft
Est. Value
About This Home
This home is located at 12047 Oak Haven Ave, Baton Rouge, LA 70810 and is currently estimated at $392,448, approximately $153 per square foot. 12047 Oak Haven Ave is a home located in East Baton Rouge Parish with nearby schools including Westdale Middle School, Tara High School, and Montessori School of Baton Rouge.
Ownership History
Date
Name
Owned For
Owner Type
Purchase Details
Closed on
Feb 27, 2012
Sold by
Snellgrove Allyson R
Bought by
Melancon Lolan J
Current Estimated Value
Home Financials for this Owner
Home Financials are based on the most recent Mortgage that was taken out on this home.
Original Mortgage
$298,020
Outstanding Balance
$205,498
Interest Rate
3.95%
Mortgage Type
VA
Estimated Equity
$186,950
Purchase Details
Closed on
Dec 1, 2005
Sold by
Murphy Kevin M
Bought by
Snellgrove Allyson R
Home Financials for this Owner
Home Financials are based on the most recent Mortgage that was taken out on this home.
Original Mortgage
$150,000
Interest Rate
5.61%
Mortgage Type
New Conventional
Purchase Details
Closed on
Sep 15, 2005
Sold by
Harvey Craig M
Bought by
Murphy Kevin M
Home Financials for this Owner
Home Financials are based on the most recent Mortgage that was taken out on this home.
Original Mortgage
$162,750
Interest Rate
5.8%
Mortgage Type
New Conventional
Create a Home Valuation Report for This Property
The Home Valuation Report is an in-depth analysis detailing your home's value as well as a comparison with similar homes in the area
Home Values in the Area
Average Home Value in this Area
Purchase History
| Date | Buyer | Sale Price | Title Company |
|---|---|---|---|
| Melancon Lolan J | $288,500 | -- | |
| Snellgrove Allyson R | $225,000 | -- | |
| Murphy Kevin M | $217,000 | -- |
Source: Public Records
Mortgage History
| Date | Status | Borrower | Loan Amount |
|---|---|---|---|
| Open | Melancon Lolan J | $298,020 | |
| Previous Owner | Snellgrove Allyson R | $150,000 | |
| Previous Owner | Murphy Kevin M | $162,750 |
Source: Public Records
Tax History Compared to Growth
Tax History
| Year | Tax Paid | Tax Assessment Tax Assessment Total Assessment is a certain percentage of the fair market value that is determined by local assessors to be the total taxable value of land and additions on the property. | Land | Improvement |
|---|---|---|---|---|
| 2024 | $2,496 | $29,000 | $2,400 | $26,600 |
| 2023 | $2,496 | $29,000 | $2,400 | $26,600 |
| 2022 | $3,285 | $29,000 | $2,400 | $26,600 |
| 2021 | $3,222 | $29,000 | $2,400 | $26,600 |
| 2020 | $3,199 | $29,000 | $2,400 | $26,600 |
| 2019 | $3,327 | $29,000 | $2,400 | $26,600 |
| 2018 | $3,283 | $29,000 | $2,400 | $26,600 |
| 2017 | $3,283 | $29,000 | $2,400 | $26,600 |
| 2016 | $2,379 | $29,000 | $2,400 | $26,600 |
| 2015 | $2,359 | $28,850 | $2,400 | $26,450 |
| 2014 | $2,307 | $28,850 | $2,400 | $26,450 |
| 2013 | -- | $28,850 | $2,400 | $26,450 |
Source: Public Records
Map
Nearby Homes
- 12037 Oak Haven Ave
- 12046 Oak Haven Ave
- 11931 Oakshire Ave
- 12006 Towering Oaks Dr
- 1342 Barkley Dr
- 1445 Oakdale Dr
- 1526 Rue Crozat
- 12115 Mirkwood Ave
- 1537 Rue Crozat
- 1434 Charing Cross Dr
- 11720 Perkins Rd
- 11710 N Oak Hills Pkwy
- 1777 Rue Desiree
- 843 Carnforth Dr
- 11142 S Lakeside Oaks Ave
- 1145 Wyatt Dr
- 11534 Settlement Blvd
- 11621 Willow Garden Ln
- 662 Wheatsheaf Dr
- 11601 Willow Garden Ln
- 12119 Oak Haven Ave
- 12032 Oakshire Ave
- 12022 Oakshire Ave
- 12027 Oak Haven Ave
- 12129 Oak Haven Ave
- 12118 Oak Haven Ave
- 12012 Oakshire Ave
- 12036 Oak Haven Ave
- 12124 Oakshire Ave
- 12128 Oak Haven Ave
- 12017 Oak Haven Ave
- 12139 Oak Haven Ave
- 12026 Oak Haven Ave
- 11940 Oakshire Ave
- 12138 Oak Haven Ave
- 12134 Oakshire Ave
- 12016 Oak Haven Ave
- 11935 Oak Haven Ave
- 12033 Oakshire Ave
- 12023 Oakshire Ave