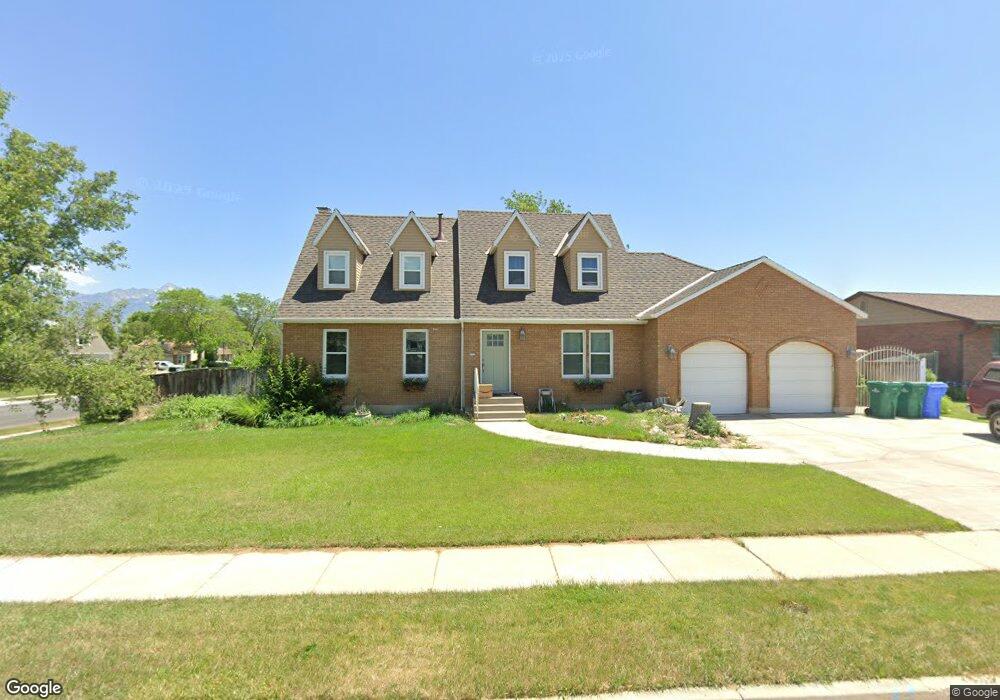
12049 S 1390 W Riverton, UT 84065
Estimated Value: $671,000 - $710,000
5
Beds
4
Baths
3,484
Sq Ft
$196/Sq Ft
Est. Value
About This Home
This home is located at 12049 S 1390 W, Riverton, UT 84065 and is currently estimated at $684,437, approximately $196 per square foot. 12049 S 1390 W is a home located in Salt Lake County with nearby schools including Rosamond Elementary School, Oquirrh Hills Middle School, and Riverton High School.
Ownership History
Date
Name
Owned For
Owner Type
Purchase Details
Closed on
Jan 21, 2022
Sold by
Cummings David J and Cummings Shawna R
Bought by
Dixon Peter D and Dixon Faunice A
Current Estimated Value
Home Financials for this Owner
Home Financials are based on the most recent Mortgage that was taken out on this home.
Original Mortgage
$278,250
Outstanding Balance
$257,562
Interest Rate
3.45%
Mortgage Type
New Conventional
Estimated Equity
$426,875
Purchase Details
Closed on
Sep 26, 2008
Sold by
Cummings David and Cummings Shawna
Bought by
Cummings David and Cummings Shawna
Purchase Details
Closed on
May 3, 1996
Sold by
Mickelsen James L and Mickelsen Analee
Bought by
Cummings David and Cummings Shawna
Home Financials for this Owner
Home Financials are based on the most recent Mortgage that was taken out on this home.
Original Mortgage
$151,900
Interest Rate
7.82%
Create a Home Valuation Report for This Property
The Home Valuation Report is an in-depth analysis detailing your home's value as well as a comparison with similar homes in the area
Home Values in the Area
Average Home Value in this Area
Purchase History
| Date | Buyer | Sale Price | Title Company |
|---|---|---|---|
| Cummings David | -- | None Available | |
| Cummings David | -- | Backman Stewart Title Svcs L | |
| Dixon Peter D | -- | Real Advantage Title Insurance | |
| Dixon Peter D | -- | Real Advantage Title Insurance |
Source: Public Records
Mortgage History
| Date | Status | Borrower | Loan Amount |
|---|---|---|---|
| Previous Owner | Cummings David | $151,900 | |
| Open | Dixon Peter D | $278,250 | |
| Closed | Dixon Peter D | $278,250 |
Source: Public Records
Tax History Compared to Growth
Tax History
| Year | Tax Paid | Tax Assessment Tax Assessment Total Assessment is a certain percentage of the fair market value that is determined by local assessors to be the total taxable value of land and additions on the property. | Land | Improvement |
|---|---|---|---|---|
| 2025 | $3,533 | $616,900 | $202,000 | $414,900 |
| 2024 | $3,533 | $611,500 | $198,300 | $413,200 |
| 2023 | $3,437 | $560,800 | $183,600 | $377,200 |
| 2022 | $3,432 | $549,300 | $180,000 | $369,300 |
| 2021 | $2,973 | $423,700 | $135,000 | $288,700 |
| 2020 | $2,834 | $376,600 | $121,000 | $255,600 |
| 2019 | $2,865 | $374,200 | $110,000 | $264,200 |
| 2018 | $2,710 | $348,500 | $110,000 | $238,500 |
| 2017 | $2,569 | $322,000 | $110,000 | $212,000 |
| 2016 | $2,566 | $308,600 | $102,000 | $206,600 |
| 2015 | $2,233 | $260,300 | $103,800 | $156,500 |
| 2014 | $2,134 | $244,000 | $98,900 | $145,100 |
Source: Public Records
Map
Nearby Homes
- 1410 W 12115 S
- 1337 Natasha Cir
- 11860 S Alysum Cir
- 12216 S 1300 W
- 1184 W Margaret Rose Dr
- 1182 River Hills Dr
- 11784 Stone Ridge Ct
- 12294 S 1490 W
- 12091 S Lampton View Dr
- 1611 W Laurel Chase Dr
- 11711 Stone Crest Cir
- 1661 W Madison View Dr
- 11694 Stone Crest Cir
- 12392 S 1300 W
- 1721 W Hollow Cedar Ln Unit 1
- 12317 S Redwood Rd
- 12325 S Redwood Rd
- 12345 S Redwood Rd
- 11664 S Lampton View Dr
- 1056 W Kate Springs Ln S Unit 10