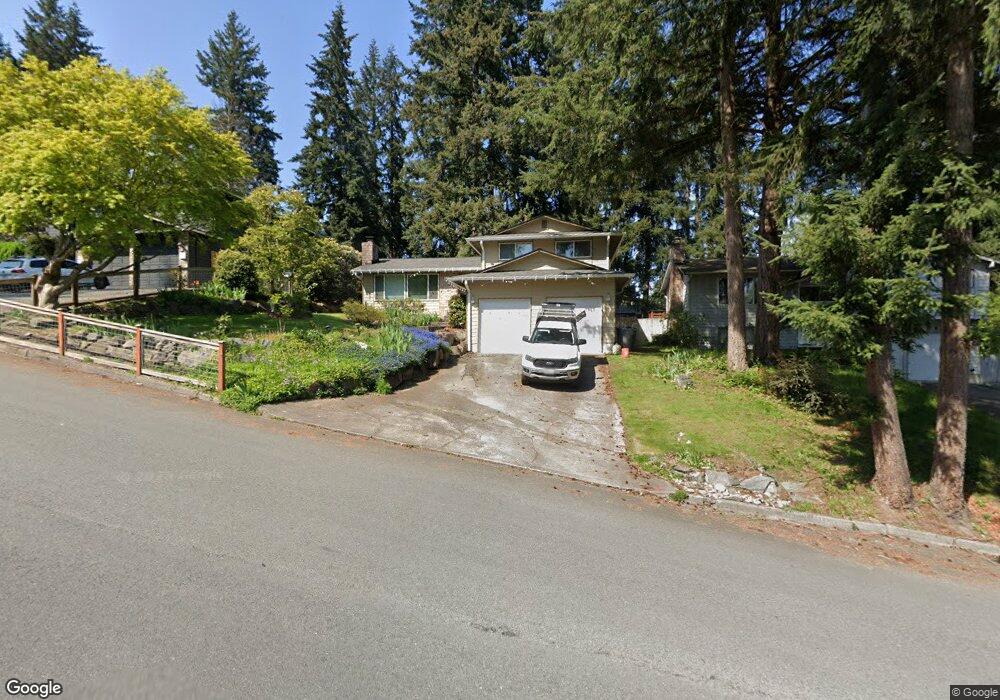
1205 202nd St SE Bothell, WA 98012
Queensborough-Brentwood NeighborhoodEstimated Value: $814,382 - $978,000
3
Beds
3
Baths
1,430
Sq Ft
$619/Sq Ft
Est. Value
About This Home
This home is located at 1205 202nd St SE, Bothell, WA 98012 and is currently estimated at $885,346, approximately $619 per square foot. 1205 202nd St SE is a home located in Snohomish County with nearby schools including Crystal Springs Elementary School, Canyon Park Junior High School, and Bothell High School.
Ownership History
Date
Name
Owned For
Owner Type
Purchase Details
Closed on
Jun 15, 2010
Sold by
Clacy Rhonda L
Bought by
Clancy James K
Current Estimated Value
Home Financials for this Owner
Home Financials are based on the most recent Mortgage that was taken out on this home.
Original Mortgage
$240,000
Outstanding Balance
$160,374
Interest Rate
4.91%
Mortgage Type
New Conventional
Estimated Equity
$724,972
Purchase Details
Closed on
Apr 13, 2000
Sold by
Zimmerman Michael K and Zimmerman Heidi A
Bought by
Field Mark and Field Elesa
Home Financials for this Owner
Home Financials are based on the most recent Mortgage that was taken out on this home.
Original Mortgage
$216,147
Interest Rate
8.26%
Mortgage Type
FHA
Purchase Details
Closed on
Aug 12, 1998
Sold by
Ultsch Robert J and Ultsch Janette R
Bought by
Zimmerman Michael K and Zimmerman Heidi A
Home Financials for this Owner
Home Financials are based on the most recent Mortgage that was taken out on this home.
Original Mortgage
$171,064
Interest Rate
6.95%
Mortgage Type
FHA
Create a Home Valuation Report for This Property
The Home Valuation Report is an in-depth analysis detailing your home's value as well as a comparison with similar homes in the area
Home Values in the Area
Average Home Value in this Area
Purchase History
| Date | Buyer | Sale Price | Title Company |
|---|---|---|---|
| Clancy James K | $56,179 | Chicago Title Insurance Co | |
| Clancy James K | $300,000 | Chicago Title | |
| Field Mark | $219,000 | -- | |
| Zimmerman Michael K | $175,450 | -- |
Source: Public Records
Mortgage History
| Date | Status | Borrower | Loan Amount |
|---|---|---|---|
| Open | Clancy James K | $240,000 | |
| Previous Owner | Field Mark | $216,147 | |
| Previous Owner | Zimmerman Michael K | $171,064 |
Source: Public Records
Tax History
| Year | Tax Paid | Tax Assessment Tax Assessment Total Assessment is a certain percentage of the fair market value that is determined by local assessors to be the total taxable value of land and additions on the property. | Land | Improvement |
|---|---|---|---|---|
| 2025 | $5,366 | $652,700 | $450,000 | $202,700 |
| 2024 | $5,366 | $635,900 | $440,000 | $195,900 |
| 2023 | $6,445 | $835,600 | $610,000 | $225,600 |
| 2022 | $5,400 | $558,800 | $366,000 | $192,800 |
| 2020 | $4,793 | $460,900 | $293,000 | $167,900 |
| 2019 | $4,123 | $405,300 | $240,000 | $165,300 |
| 2018 | $3,919 | $363,200 | $215,000 | $148,200 |
| 2017 | $3,313 | $314,800 | $178,000 | $136,800 |
| 2016 | $3,219 | $296,300 | $165,000 | $131,300 |
Source: Public Records
Map
Nearby Homes
- 20224 11th Dr SE
- 19921 10th Dr SE
- 1126 199th St SE
- 1216 199th St SE
- 820 Grimes Rd
- 20318 Bothell Everett Hwy Unit A303
- 20511 Greening Rd
- 20029 7th Ave SE
- 1820 201st Place SE
- 727 198th Place SE
- 1615 208th St SE Unit 42
- 1402 194th St SE Unit 1
- 429 203rd Place SE
- 1322 194th St SE Unit B4
- 1322 194th St SE Unit B7
- 1322 194th St SE Unit B2
- 1322 194th St SE Unit B1
- 1322 194th St SE Unit B6
- 2115 201st Place SE Unit F4
- 2115 201st Place SE Unit K2
- 1211 202nd St SE
- 1131 202nd St SE Unit B
- 1131 202nd St SE Unit A
- 1131 202nd St SE
- 1217 202nd St SE
- 1202 200th Place SE
- 1208 200th Place SE
- 1125 202nd St SE
- 20208 12th Dr SE
- 1126 200th Place SE
- 1220 200th Place SE
- 20120 13th Dr SE
- 1117 202nd St SE
- 20209 12th Dr SE
- 20126 13th Dr SE
- 20205 11th Dr SE
- 1118 200th Place SE
- 20214 12th Dr SE
- 20206 13th Dr SE
- 1111 202nd St SE
Your Personal Tour Guide
Ask me questions while you tour the home.