Estimated Value: $106,172 - $149,000
3
Beds
1
Bath
1,336
Sq Ft
$99/Sq Ft
Est. Value
About This Home
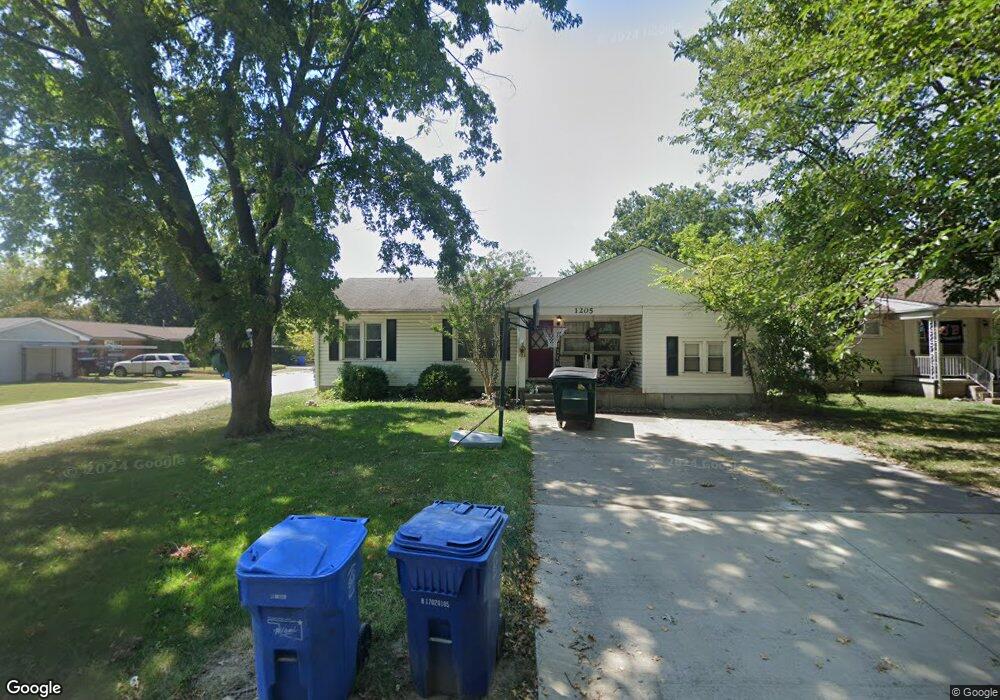
This home is located at 1205 B St NE, Miami, OK 74354 and is currently estimated at $131,793, approximately $98 per square foot. 1205 B St NE is a home located in Ottawa County with nearby schools including Miami High School and Mt. Olive Lutheran School.
Ownership History
Date
Name
Owned For
Owner Type
Purchase Details
Closed on
Apr 3, 2015
Sold by
Davis Joshua
Bought by
Hilburn Callie D
Current Estimated Value
Home Financials for this Owner
Home Financials are based on the most recent Mortgage that was taken out on this home.
Original Mortgage
$73,641
Outstanding Balance
$57,803
Interest Rate
4.37%
Mortgage Type
FHA
Estimated Equity
$73,990
Purchase Details
Closed on
Aug 28, 2009
Sold by
Woods Shanna J and Woods Darren W
Bought by
Davis Joshua
Home Financials for this Owner
Home Financials are based on the most recent Mortgage that was taken out on this home.
Original Mortgage
$74,200
Interest Rate
5.16%
Mortgage Type
New Conventional
Purchase Details
Closed on
Sep 17, 1998
Bought by
Woods Shanna J
Purchase Details
Closed on
May 20, 1993
Bought by
Durborow Don and Kelly Jo
Create a Home Valuation Report for This Property
The Home Valuation Report is an in-depth analysis detailing your home's value as well as a comparison with similar homes in the area
Home Values in the Area
Average Home Value in this Area
Purchase History
| Date | Buyer | Sale Price | Title Company |
|---|---|---|---|
| Hilburn Callie D | $75,000 | None Available | |
| Davis Joshua | $69,000 | None Available | |
| Woods Shanna J | $44,000 | -- | |
| Durborow Don | -- | -- |
Source: Public Records
Mortgage History
| Date | Status | Borrower | Loan Amount |
|---|---|---|---|
| Open | Hilburn Callie D | $73,641 | |
| Previous Owner | Davis Joshua | $74,200 |
Source: Public Records
Tax History Compared to Growth
Tax History
| Year | Tax Paid | Tax Assessment Tax Assessment Total Assessment is a certain percentage of the fair market value that is determined by local assessors to be the total taxable value of land and additions on the property. | Land | Improvement |
|---|---|---|---|---|
| 2025 | $953 | $10,036 | $741 | $9,295 |
| 2024 | $953 | $9,883 | $544 | $9,339 |
| 2023 | $953 | $9,413 | $445 | $8,968 |
| 2022 | $829 | $8,965 | $445 | $8,520 |
| 2021 | $807 | $8,538 | $445 | $8,093 |
| 2020 | $775 | $8,132 | $633 | $7,499 |
| 2019 | $636 | $7,745 | $445 | $7,300 |
| 2018 | $640 | $7,745 | $445 | $7,300 |
| 2017 | $651 | $7,745 | $445 | $7,300 |
| 2016 | $641 | $7,975 | $445 | $7,530 |
| 2015 | $610 | $7,867 | $570 | $7,297 |
| 2014 | $562 | $7,867 | $570 | $7,297 |
Source: Public Records
Map
Nearby Homes