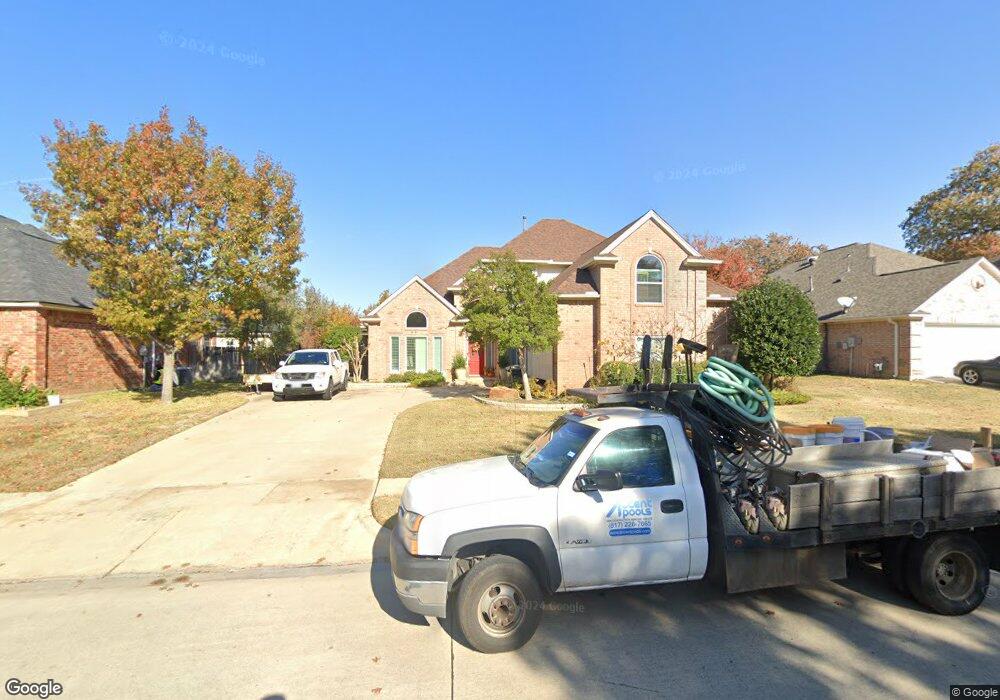
1205 Carousel Dr Bedford, TX 76021
Estimated Value: $630,000 - $813,000
4
Beds
2
Baths
3,260
Sq Ft
$209/Sq Ft
Est. Value
About This Home
This home is located at 1205 Carousel Dr, Bedford, TX 76021 and is currently estimated at $680,480, approximately $208 per square foot. 1205 Carousel Dr is a home located in Tarrant County with nearby schools including Bedford Heights Elementary School, Bedford Junior High School, and L.D. Bell High School.
Ownership History
Date
Name
Owned For
Owner Type
Purchase Details
Closed on
Jun 28, 2000
Sold by
Hood Robert J and Hood Rosa A
Bought by
Dempsey Russel Ray and Dempsey Rene
Current Estimated Value
Home Financials for this Owner
Home Financials are based on the most recent Mortgage that was taken out on this home.
Original Mortgage
$60,000
Interest Rate
8.66%
Purchase Details
Closed on
Feb 27, 1997
Sold by
Adrian Hill Construction Inc
Bought by
Hood Robert J and Hood Rosa A
Home Financials for this Owner
Home Financials are based on the most recent Mortgage that was taken out on this home.
Original Mortgage
$183,350
Interest Rate
7.92%
Purchase Details
Closed on
Nov 10, 1994
Sold by
United International Corp
Bought by
Adrian Hill Construction Inc
Home Financials for this Owner
Home Financials are based on the most recent Mortgage that was taken out on this home.
Original Mortgage
$190,400
Interest Rate
8.99%
Create a Home Valuation Report for This Property
The Home Valuation Report is an in-depth analysis detailing your home's value as well as a comparison with similar homes in the area
Home Values in the Area
Average Home Value in this Area
Purchase History
| Date | Buyer | Sale Price | Title Company |
|---|---|---|---|
| Dempsey Russel Ray | -- | Rattikin Title Co | |
| Hood Robert J | -- | American Title Company | |
| Adrian Hill Construction Inc | -- | First American Title Co |
Source: Public Records
Mortgage History
| Date | Status | Borrower | Loan Amount |
|---|---|---|---|
| Closed | Dempsey Russel Ray | $60,000 | |
| Previous Owner | Hood Robert J | $183,350 | |
| Previous Owner | Adrian Hill Construction Inc | $190,400 |
Source: Public Records
Tax History Compared to Growth
Tax History
| Year | Tax Paid | Tax Assessment Tax Assessment Total Assessment is a certain percentage of the fair market value that is determined by local assessors to be the total taxable value of land and additions on the property. | Land | Improvement |
|---|---|---|---|---|
| 2025 | $3,064 | $588,310 | $100,000 | $488,310 |
| 2024 | $3,064 | $588,310 | $100,000 | $488,310 |
| 2023 | $9,783 | $605,024 | $75,000 | $530,024 |
| 2022 | $10,128 | $512,633 | $75,000 | $437,633 |
| 2021 | $9,930 | $421,558 | $75,000 | $346,558 |
| 2020 | $10,081 | $423,995 | $75,000 | $348,995 |
| 2019 | $10,360 | $426,432 | $75,000 | $351,432 |
| 2018 | $5,102 | $395,617 | $75,000 | $320,617 |
| 2017 | $8,820 | $388,860 | $50,000 | $338,860 |
| 2016 | $8,018 | $331,450 | $50,000 | $281,450 |
| 2015 | $5,054 | $310,000 | $25,000 | $285,000 |
| 2014 | $5,054 | $310,000 | $25,000 | $285,000 |
Source: Public Records
Map
Nearby Homes
- 3301 Wendover Ct
- 1209 Hillandale Ct
- 1109 Simpson Terrace
- 913 Kensington Ct
- 3609 Wayne Ct
- 1401 Danielle Dr
- 3624 Wayne Ct
- 1136 Wingate Dr
- 1013 Springdale Rd
- 3119 Spring Grove Dr
- 1636 Bedford Oaks Dr
- 2700 Shady Grove Dr
- 1704 Indian Oaks Ct
- 3213 Spring Valley Dr
- 922 Shady Creek Ln
- 3605 Spring Valley Dr
- 2901 Miles Way
- 801 Shady Creek Ln
- 909 Brestol Ct W
- 1800 Hampton Dr
- 1209 Carousel Dr
- 1201 Carousel Dr
- 1204 Crestview Dr
- 1208 Crestview Dr
- 1213 Carousel Dr
- 1200 Crestview Dr
- 1121 Carousel Dr
- 1208 Carousel Dr
- 1212 Crestview Dr
- 1120 Crestview Dr
- 1117 Carousel Dr
- 1212 Carousel Dr
- 1120 Carousel Dr
- 1217 Carousel Dr
- 1116 Crestview Dr
- 1216 Crestview Dr
- 1116 Carousel Dr
- 1216 Carousel Dr
- 1201 Timber View Dr
- 1113 Carousel Dr