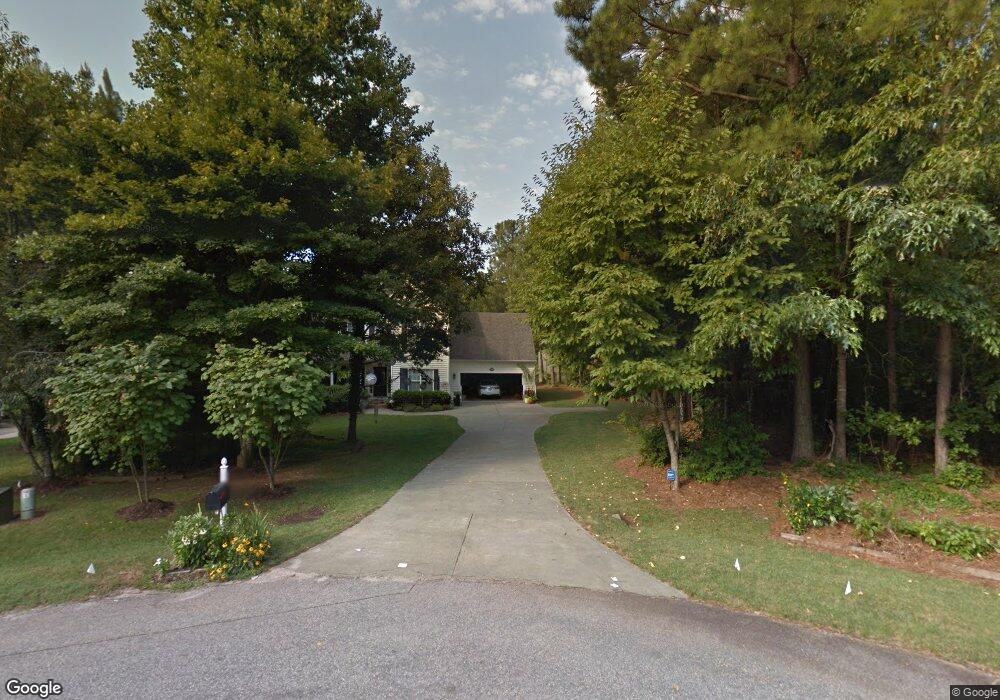
1205 Cleason Ct Wake Forest, NC 27587
Falls Lake NeighborhoodEstimated Value: $447,000 - $600,000
3
Beds
3
Baths
2,100
Sq Ft
$240/Sq Ft
Est. Value
About This Home
This home is located at 1205 Cleason Ct, Wake Forest, NC 27587 and is currently estimated at $504,072, approximately $240 per square foot. 1205 Cleason Ct is a home located in Wake County with nearby schools including North Forest Pines Elementary School, Wakefield Middle, and Wakefield High School.
Ownership History
Date
Name
Owned For
Owner Type
Purchase Details
Closed on
May 14, 2025
Sold by
Carroll Linda
Bought by
Carroll Linda and Hahn Dean Alan
Current Estimated Value
Purchase Details
Closed on
Apr 4, 2005
Sold by
Hahn Dean and Hahn Elizabeth
Bought by
Carroll Linda
Home Financials for this Owner
Home Financials are based on the most recent Mortgage that was taken out on this home.
Original Mortgage
$173,600
Interest Rate
5.99%
Mortgage Type
Fannie Mae Freddie Mac
Purchase Details
Closed on
Dec 15, 1999
Sold by
Sawyer Homes Inc
Bought by
Hahn Dean and Hahn Elizabeth
Home Financials for this Owner
Home Financials are based on the most recent Mortgage that was taken out on this home.
Original Mortgage
$171,900
Interest Rate
6.75%
Purchase Details
Closed on
Feb 24, 1999
Sold by
Smith Charles Oliver
Bought by
Sawyer Homes Inc
Home Financials for this Owner
Home Financials are based on the most recent Mortgage that was taken out on this home.
Original Mortgage
$139,100
Interest Rate
6.84%
Mortgage Type
Construction
Create a Home Valuation Report for This Property
The Home Valuation Report is an in-depth analysis detailing your home's value as well as a comparison with similar homes in the area
Home Values in the Area
Average Home Value in this Area
Purchase History
| Date | Buyer | Sale Price | Title Company |
|---|---|---|---|
| Carroll Linda | -- | None Listed On Document | |
| Carroll Linda | -- | None Listed On Document | |
| Carroll Linda | $171,000 | -- | |
| Hahn Dean | $191,000 | -- | |
| Sawyer Homes Inc | $33,000 | -- |
Source: Public Records
Mortgage History
| Date | Status | Borrower | Loan Amount |
|---|---|---|---|
| Previous Owner | Carroll Linda | $173,600 | |
| Previous Owner | Hahn Dean | $171,900 | |
| Previous Owner | Sawyer Homes Inc | $139,100 |
Source: Public Records
Tax History
| Year | Tax Paid | Tax Assessment Tax Assessment Total Assessment is a certain percentage of the fair market value that is determined by local assessors to be the total taxable value of land and additions on the property. | Land | Improvement |
|---|---|---|---|---|
| 2025 | $2,739 | $425,061 | $80,000 | $345,061 |
| 2024 | $2,660 | $425,061 | $80,000 | $345,061 |
| 2023 | $2,127 | $270,250 | $54,000 | $216,250 |
| 2022 | $1,972 | $270,250 | $54,000 | $216,250 |
| 2021 | $1,919 | $270,250 | $54,000 | $216,250 |
| 2020 | $1,887 | $270,250 | $54,000 | $216,250 |
| 2019 | $1,823 | $220,734 | $54,000 | $166,734 |
| 2018 | $1,676 | $220,734 | $54,000 | $166,734 |
| 2017 | $1,589 | $220,734 | $54,000 | $166,734 |
| 2016 | $1,557 | $220,734 | $54,000 | $166,734 |
| 2015 | $1,593 | $226,426 | $60,000 | $166,426 |
| 2014 | -- | $226,426 | $60,000 | $166,426 |
Source: Public Records
Map
Nearby Homes
- 8500 Moose Way
- 8128 Baronleigh Ln
- 1100 Harrison Ridge Rd
- 8112 Baronleigh Ln
- 8012 Woodcross Way
- 8208 Mary Claire Ln
- 1232 Perry Bluff Dr
- 1224 Perry Bluff Dr
- 8201 Mary Claire Ln
- 1216 Perry Bluff Dr
- 1212 Perry Bluff Dr
- 1117 Delilia Ln
- 8613 Breezy Grove Trail
- 1208 Perry Bluff Dr
- 1112 Delilia Ln
- 1109 Delilia Ln
- 7628 Stony Hill Rd
- 7440 Hasentree Way
- 913 Harrison Ridge Rd
- 1733 Hasentree Villa Ln
- 1209 Cleason Ct
- 1201 Cleason Ct
- 1212 Cleason Ct
- 8004 Stony Hill Rd
- 1208 Cleason Ct
- LOT 6 Cleason Ct
- LOT 10 Cleason Ct
- LOT 11 Cleason Ct
- LOT 12 Cleason Ct
- LOT 13 Cleason Ct
- LOT 9 Cleason Ct
- 1204 Cleason Ct
- 1200 Cleason Ct
- 1405 The Pines Place
- 1405 Two Pines Trail
- 8021 Hinton Rd
- 8029 Stony Hill Rd Unit 1
- 8029 Stony Hill Rd
- 7916 Stone Forest Way
- 8017 Hinton Rd
Your Personal Tour Guide
Ask me questions while you tour the home.