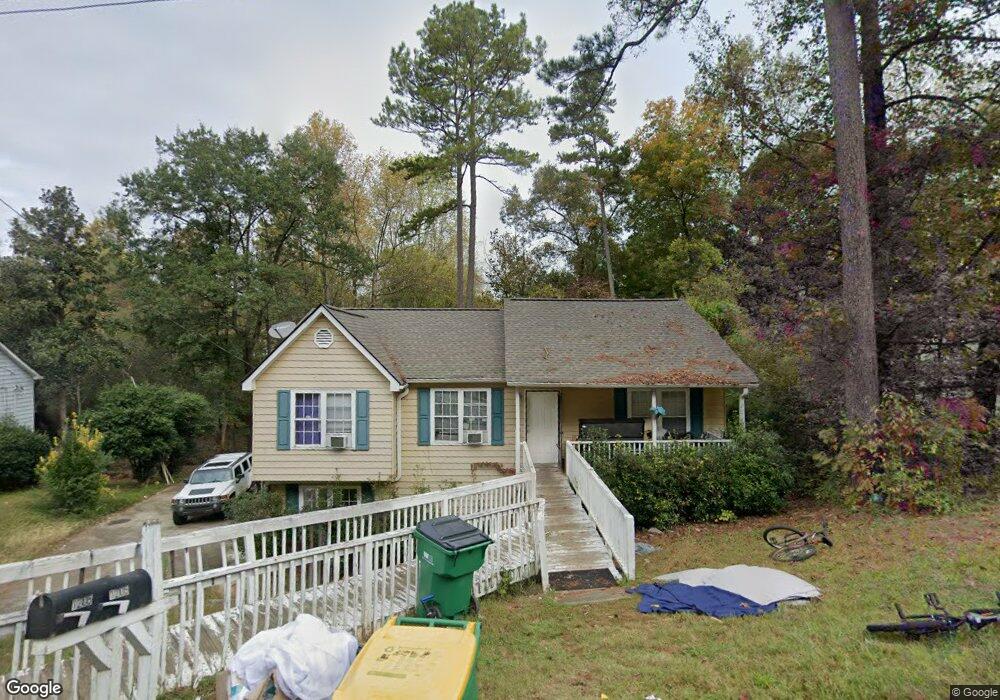
1205 Cousins Rd Woodstock, GA 30188
Estimated Value: $360,142 - $367,000
3
Beds
2
Baths
1,200
Sq Ft
$303/Sq Ft
Est. Value
About This Home
This home is located at 1205 Cousins Rd, Woodstock, GA 30188 and is currently estimated at $363,571, approximately $302 per square foot. 1205 Cousins Rd is a home located in Cherokee County with nearby schools including Woodstock Elementary School, Woodstock Middle School, and Woodstock High School.
Ownership History
Date
Name
Owned For
Owner Type
Purchase Details
Closed on
Jan 15, 2010
Sold by
Hud-Housing Of Urban Dev
Bought by
Narvaez Herlinda
Current Estimated Value
Home Financials for this Owner
Home Financials are based on the most recent Mortgage that was taken out on this home.
Original Mortgage
$88,441
Outstanding Balance
$59,291
Interest Rate
5.37%
Mortgage Type
FHA
Estimated Equity
$304,280
Purchase Details
Closed on
Aug 4, 2009
Sold by
Colonial Svgs Fa
Bought by
Hud-Housing Of Urban Dev
Purchase Details
Closed on
Mar 23, 2001
Sold by
Bryant Keri and Bryant Chirstina
Bought by
Mungai Marion W
Home Financials for this Owner
Home Financials are based on the most recent Mortgage that was taken out on this home.
Original Mortgage
$107,650
Interest Rate
7.02%
Purchase Details
Closed on
Mar 21, 1995
Sold by
Charles Goodell
Bought by
Teaque Grady Jean
Create a Home Valuation Report for This Property
The Home Valuation Report is an in-depth analysis detailing your home's value as well as a comparison with similar homes in the area
Home Values in the Area
Average Home Value in this Area
Purchase History
| Date | Buyer | Sale Price | Title Company |
|---|---|---|---|
| Narvaez Herlinda | -- | -- | |
| Hud-Housing Of Urban Dev | -- | -- | |
| Colonial Svgs Fa | $104,325 | -- | |
| Mungai Marion W | $109,400 | -- | |
| Teaque Grady Jean | $80,000 | -- |
Source: Public Records
Mortgage History
| Date | Status | Borrower | Loan Amount |
|---|---|---|---|
| Open | Narvaez Herlinda | $88,441 | |
| Previous Owner | Mungai Marion W | $107,650 | |
| Closed | Teaque Grady Jean | $0 |
Source: Public Records
Tax History Compared to Growth
Tax History
| Year | Tax Paid | Tax Assessment Tax Assessment Total Assessment is a certain percentage of the fair market value that is determined by local assessors to be the total taxable value of land and additions on the property. | Land | Improvement |
|---|---|---|---|---|
| 2024 | $3,327 | $117,380 | $29,480 | $87,900 |
| 2023 | $719 | $129,992 | $29,480 | $100,512 |
| 2022 | $3,299 | $112,048 | $29,480 | $82,568 |
| 2021 | $2,494 | $99,380 | $29,480 | $69,900 |
| 2020 | $2,335 | $92,956 | $27,280 | $65,676 |
| 2019 | $1,853 | $73,680 | $21,000 | $52,680 |
| 2018 | $1,560 | $61,600 | $16,800 | $44,800 |
| 2017 | $1,295 | $147,800 | $14,400 | $44,720 |
| 2016 | $1,295 | $125,800 | $14,400 | $35,920 |
| 2015 | $1,226 | $118,000 | $10,800 | $36,400 |
| 2014 | $1,074 | $103,200 | $8,200 | $33,080 |
Source: Public Records
Map
Nearby Homes
- 147 Hubbard Rd
- 719 Hammond Dr
- 191 Fowler St
- 170 Fowler St Unit 100
- 170 Fowler St Unit 200
- 304 Winchester Way
- 360 Chambers St Unit 155
- 360 Chambers St Unit 456
- 360 Chambers St Unit 408
- 360 Chambers St Unit 407
- 360 Chambers St Unit 210
- 360 Chambers St Unit 402
- 360 Chambers St Unit 405
- 360 Chambers St Unit 301
- 114 Parks Cir
- 204 Melanie Ln
- The Barrington Plan at South on Main
- 108 Barnesdale Terrace
- 110 Barnesdale Terrace
- 1203 Cousins Rd
- 1208 Cousins Rd
- 1201 Cousins Rd
- 1207 Cousins Rd
- 1206 Cousins Rd
- 1209 Cousins Rd Unit II
- 155 Bentley Pkwy
- 1210 Cousins Rd
- 1204 Cousins Rd Unit 36
- 1204 Cousins Rd
- 157 Bentley Pkwy
- 153 Bentley Pkwy
- 159 Bentley Pkwy
- 1202 Cousins Rd
- 442 Windsong Way
- 440 Windsong Way
- 411 Windsong Way
- 151 Bentley Pkwy Unit II
- 161 Bentley Pkwy
- 142 Bentley Pkwy