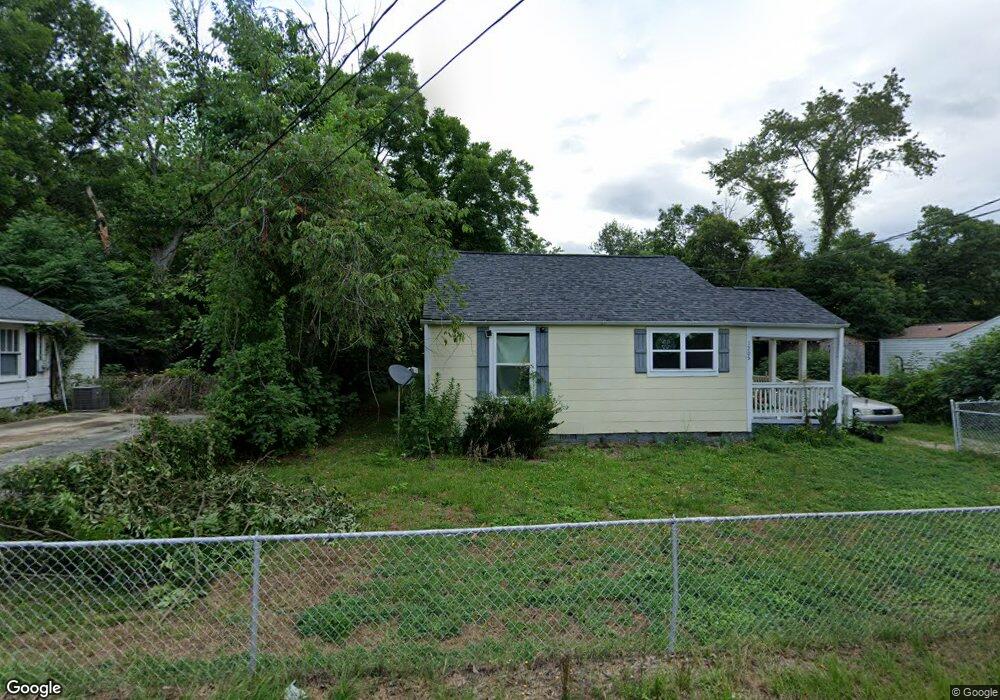
1205 Deloach St Camden, SC 29020
Estimated Value: $116,000 - $162,000
2
Beds
1
Bath
858
Sq Ft
$151/Sq Ft
Est. Value
About This Home
This home is located at 1205 Deloach St, Camden, SC 29020 and is currently estimated at $129,528, approximately $150 per square foot. 1205 Deloach St is a home located in Kershaw County with nearby schools including Jackson School, Pine Tree Hill Elementary School, and Camden Middle School.
Ownership History
Date
Name
Owned For
Owner Type
Purchase Details
Closed on
May 13, 2025
Sold by
Dekrafft Charles and Wissick Cheryl A
Bought by
De Krafft-Wissick Family Revocable Living Tru and De Krafft
Current Estimated Value
Purchase Details
Closed on
Oct 4, 2021
Sold by
Simon Maleta N
Bought by
Dekrafft Charles and De Krafft Phillip
Purchase Details
Closed on
Dec 30, 2019
Sold by
Williams Chad E
Bought by
Simon Maleta N
Home Financials for this Owner
Home Financials are based on the most recent Mortgage that was taken out on this home.
Original Mortgage
$73,737
Interest Rate
3.7%
Mortgage Type
New Conventional
Purchase Details
Closed on
Nov 1, 2018
Sold by
Clyburn Price Joseph
Bought by
Williams Chad E and Williams Tiffany M
Purchase Details
Closed on
Jun 25, 2018
Sold by
West Jerry M
Bought by
Price Joseph Clyburn
Purchase Details
Closed on
Nov 25, 1992
Sold by
Guinn Gail C and Guinn Oveda B
Bought by
West Jerry M and West Zyphia T
Create a Home Valuation Report for This Property
The Home Valuation Report is an in-depth analysis detailing your home's value as well as a comparison with similar homes in the area
Home Values in the Area
Average Home Value in this Area
Purchase History
| Date | Buyer | Sale Price | Title Company |
|---|---|---|---|
| De Krafft-Wissick Family Revocable Living Tru | -- | None Listed On Document | |
| De Krafft-Wissick Family Revocable Living Tru | -- | None Listed On Document | |
| Dekrafft Charles | $105,000 | Foster Law Office Llc | |
| Simon Maleta N | $73,000 | Conder Anne S | |
| Williams Chad E | $13,000 | Davis Robert Wilson | |
| Williams Chad E | $13,000 | Davis Robert Wilson | |
| Price Joseph Clyburn | $63,000 | Connell Law Firm Llc | |
| Price Joseph Clyburn | $63,000 | Connell Law Firm Llc | |
| West Jerry M | $32,000 | -- |
Source: Public Records
Mortgage History
| Date | Status | Borrower | Loan Amount |
|---|---|---|---|
| Previous Owner | Simon Maleta N | $73,737 |
Source: Public Records
Tax History Compared to Growth
Tax History
| Year | Tax Paid | Tax Assessment Tax Assessment Total Assessment is a certain percentage of the fair market value that is determined by local assessors to be the total taxable value of land and additions on the property. | Land | Improvement |
|---|---|---|---|---|
| 2025 | $538 | $85,200 | $20,000 | $65,200 |
| 2024 | $538 | $85,200 | $20,000 | $65,200 |
| 2023 | $1,006 | $85,200 | $20,000 | $65,200 |
| 2022 | $1,619 | $85,200 | $20,000 | $65,200 |
| 2021 | $442 | $75,200 | $10,000 | $65,200 |
| 2020 | $1,377 | $73,000 | $7,500 | $65,500 |
| 2019 | $547 | $26,000 | $7,500 | $18,500 |
| 2018 | $80 | $26,000 | $7,500 | $18,500 |
| 2017 | $536 | $26,000 | $7,500 | $18,500 |
| 2016 | $537 | $26,400 | $6,000 | $20,400 |
| 2015 | $599 | $26,400 | $6,000 | $20,400 |
| 2014 | $599 | $0 | $0 | $0 |
Source: Public Records
Map
Nearby Homes
- 1514 Lewis St
- 1205 Jefferson Davis Hwy
- 1221 Mcrae Rd
- 1010 Pineview St
- 1518 Woodlawn Dr
- 1517 Albert St
- 805 Mcrae Rd
- 0 Lake Hermitage Development Site
- 1103 Woodlawn Dr
- 1820 Camden Ave
- 1725 Haile St
- 1853 Hasty Rd
- 276 Shadowbrook Way
- 236 Shadowbrook Way
- 285 Shadowbrook Way
- 1116 Mathis Ct
- 1 Belle Ct
- 434 Hound Hollow Rd
- 165 Shadowbrook Way
- 125 Shadowbrook Way
- 1205 Deloache St
- 1207 Deloache St
- 1207 1207
- 1203 Deloache St
- 1202 Deloache St
- 1201 Deloache St
- 1503 Jefferson Davis Hwy
- 1501 Jefferson Davis Hwy
- 1106 Sherwood Ln
- 1109 Windsor Dr
- 1501 Hilton St
- 1104 Sherwood Ln
- 1315 Jefferson Davis Hwy
- 1509 Jefferson Davis Hwy
- 1503 Hilton St
- 1107 Windsor Dr
- 1508 Hilton St
- 1102 Sherwood Ln
- 1505 Hilton St
- 1311A Jefferson Davis Hwy