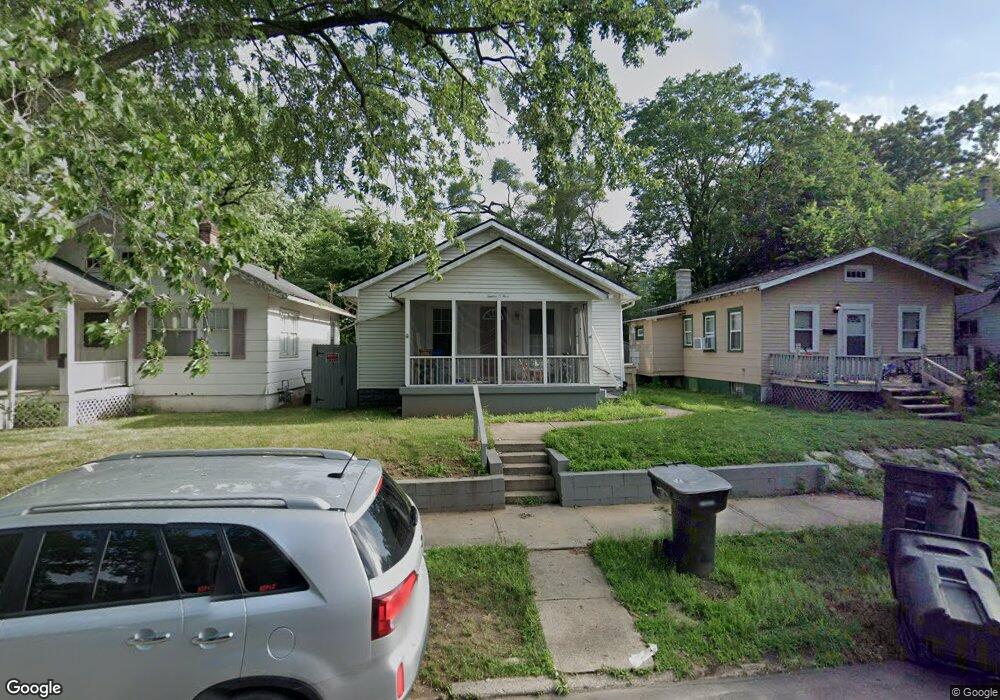
1205 E Fox St South Bend, IN 46613
Estimated Value: $112,000 - $134,000
2
Beds
1
Bath
824
Sq Ft
$150/Sq Ft
Est. Value
About This Home
This home is located at 1205 E Fox St, South Bend, IN 46613 and is currently estimated at $123,460, approximately $149 per square foot. 1205 E Fox St is a home located in St. Joseph County with nearby schools including Lincoln Elementary School, Marshall Traditional School, and Clay Intermediate Center.
Ownership History
Date
Name
Owned For
Owner Type
Purchase Details
Closed on
Oct 21, 2022
Sold by
Mishawaka Drywall Llc
Bought by
Corral Juan A and Corral Ariadna M
Current Estimated Value
Purchase Details
Closed on
Jul 12, 2021
Sold by
St Joseph County Sheriff
Bought by
Mishawaka Drywall Llc
Purchase Details
Closed on
May 10, 2012
Sold by
Hummel Goldie M
Bought by
Hummel Goldie M and Stewart Robin K
Purchase Details
Closed on
May 30, 2007
Sold by
Hoyt Dennis A
Bought by
Hummel Goldie M
Home Financials for this Owner
Home Financials are based on the most recent Mortgage that was taken out on this home.
Original Mortgage
$57,600
Interest Rate
6.22%
Mortgage Type
New Conventional
Purchase Details
Closed on
Sep 8, 2005
Sold by
Wells Fargo Bank Na
Bought by
Secretary Of Veterans Affairs
Create a Home Valuation Report for This Property
The Home Valuation Report is an in-depth analysis detailing your home's value as well as a comparison with similar homes in the area
Purchase History
| Date | Buyer | Sale Price | Title Company |
|---|---|---|---|
| Corral Juan A | $80,000 | -- | |
| Mishawaka Drywall Llc | $27,000 | None Available | |
| Hummel Goldie M | -- | -- | |
| Hummel Goldie M | -- | Metropolitan Title In Llc | |
| Secretary Of Veterans Affairs | -- | None Available | |
| Wells Fargo Bank Na | -- | None Available |
Source: Public Records
Mortgage History
| Date | Status | Borrower | Loan Amount |
|---|---|---|---|
| Previous Owner | Hummel Goldie M | $57,600 |
Source: Public Records
Tax History
| Year | Tax Paid | Tax Assessment Tax Assessment Total Assessment is a certain percentage of the fair market value that is determined by local assessors to be the total taxable value of land and additions on the property. | Land | Improvement |
|---|---|---|---|---|
| 2024 | $2,456 | $119,900 | $5,300 | $114,600 |
| 2023 | $2,429 | $101,200 | $5,300 | $95,900 |
| 2022 | $2,429 | $101,200 | $5,300 | $95,900 |
| 2021 | $881 | $75,000 | $4,300 | $70,700 |
| 2020 | $782 | $68,000 | $3,700 | $64,300 |
| 2019 | $715 | $67,200 | $3,600 | $63,600 |
| 2018 | $647 | $58,600 | $3,200 | $55,400 |
| 2017 | $490 | $45,500 | $2,500 | $43,000 |
| 2016 | $497 | $45,500 | $2,500 | $43,000 |
| 2014 | $494 | $47,800 | $2,700 | $45,100 |
Source: Public Records
Map
Nearby Homes
- 1613 Leer St
- 1133 E Donald St
- 1112 E Fox St
- 1410 E Calvert St
- 1726 Leer St
- 1748 Leer St
- 1339 E Bowman St
- 1340 E Calvert St
- 922 Milton St
- 1405 Randolph St
- 1516 E Fox St
- 822 E Ewing Ave
- 811 E Ewing Ave
- 1619 Leer St
- 1610 E Donald St
- 1160 E Indiana Ave
- 1336 E Dubail Ave
- 809 E Fairview Ave
- 1513 Ottawa Ct
- 822 E Irvington Ave
- 1201 E Fox St
- 1207 E Fox St
- 1211 E Fox St
- 1213 E Fox St
- 1206 E Donald St
- 1208 E Donald St
- 1202 E Donald St
- 1161 E Fox St
- 1212 E Donald St
- 1217 E Fox St
- 1214 E Donald St
- 1159 E Fox St
- 1164 E Donald St
- 1206 E Fox St
- 1218 E Donald St
- 1202 E Fox St
- 1208 E Fox St
- 1223 E Fox St
- 1162 E Donald St
- 1157 E Fox St
Your Personal Tour Guide
Ask me questions while you tour the home.