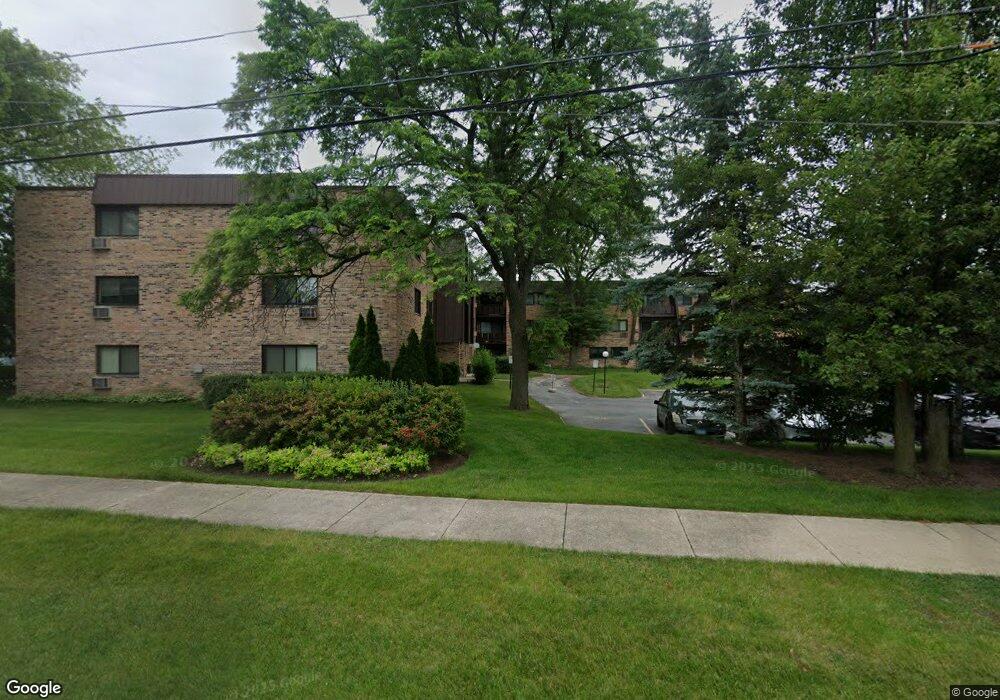
1205 E Hintz Rd Unit 22 Arlington Heights, IL 60004
Estimated Value: $175,289 - $209,000
2
Beds
--
Bath
44,100
Sq Ft
$5/Sq Ft
Est. Value
About This Home
This home is located at 1205 E Hintz Rd Unit 22, Arlington Heights, IL 60004 and is currently estimated at $199,822, approximately $4 per square foot. 1205 E Hintz Rd Unit 22 is a home located in Cook County with nearby schools including Ivy Hill Elementary School, Thomas Middle School, and Buffalo Grove High School.
Ownership History
Date
Name
Owned For
Owner Type
Purchase Details
Closed on
Apr 7, 2004
Sold by
Cheker Babicki Michelle and Martino Irys Gail
Bought by
Tsesnokova Marina
Current Estimated Value
Home Financials for this Owner
Home Financials are based on the most recent Mortgage that was taken out on this home.
Original Mortgage
$118,400
Outstanding Balance
$68,187
Interest Rate
9%
Mortgage Type
Unknown
Estimated Equity
$131,635
Purchase Details
Closed on
Aug 5, 1999
Sold by
Tenuta William J
Bought by
Cheker Babicki Michelle and Martino Irys Gail
Purchase Details
Closed on
Apr 28, 1999
Sold by
Banco Popular North America
Bought by
Tenuta William J
Home Financials for this Owner
Home Financials are based on the most recent Mortgage that was taken out on this home.
Original Mortgage
$85,500
Interest Rate
6.75%
Purchase Details
Closed on
Oct 16, 1997
Sold by
Staar Ursula
Bought by
Banco Popular Illinois and Trust #26553
Create a Home Valuation Report for This Property
The Home Valuation Report is an in-depth analysis detailing your home's value as well as a comparison with similar homes in the area
Home Values in the Area
Average Home Value in this Area
Purchase History
| Date | Buyer | Sale Price | Title Company |
|---|---|---|---|
| Tsesnokova Marina | $148,000 | Git | |
| Cheker Babicki Michelle | $97,500 | -- | |
| Tenuta William J | $90,000 | First American Title | |
| Banco Popular Illinois | -- | -- |
Source: Public Records
Mortgage History
| Date | Status | Borrower | Loan Amount |
|---|---|---|---|
| Open | Tsesnokova Marina | $118,400 | |
| Previous Owner | Tenuta William J | $85,500 | |
| Closed | Tsesnokova Marina | $29,600 |
Source: Public Records
Tax History Compared to Growth
Tax History
| Year | Tax Paid | Tax Assessment Tax Assessment Total Assessment is a certain percentage of the fair market value that is determined by local assessors to be the total taxable value of land and additions on the property. | Land | Improvement |
|---|---|---|---|---|
| 2024 | $2,862 | $13,770 | $3,344 | $10,426 |
| 2023 | $2,729 | $13,770 | $3,344 | $10,426 |
| 2022 | $2,729 | $13,770 | $3,344 | $10,426 |
| 2021 | $2,335 | $11,086 | $380 | $10,706 |
| 2020 | $2,341 | $11,086 | $380 | $10,706 |
| 2019 | $2,345 | $12,359 | $380 | $11,979 |
| 2018 | $1,380 | $8,164 | $304 | $7,860 |
| 2017 | $1,381 | $8,164 | $304 | $7,860 |
| 2016 | $1,524 | $8,164 | $304 | $7,860 |
| 2015 | $1,448 | $7,526 | $1,444 | $6,082 |
| 2014 | $1,421 | $7,526 | $1,444 | $6,082 |
| 2013 | $1,683 | $8,651 | $1,444 | $7,207 |
Source: Public Records
Map
Nearby Homes
- 2640 N Windsor Dr Unit 102
- 2604 N Windsor Dr Unit 206
- 2604 N Windsor Dr Unit 307
- 2632 N Windsor Dr Unit 104
- 2620 N Windsor Dr Unit 201
- 2620 N Windsor Dr Unit 204
- 2608 N Wilshire Ln
- 2624 N Prindle Ave
- 1306 E Best Dr
- 2616 N Prindle Ave
- 504 E Sunset Dr
- 1038 Harbour Ct Unit 2A
- 2143 E Peachtree Ln
- 1054 Harbour Ct Unit 1A
- 1500 Harbour Dr Unit 2K
- 1500 Harbour Dr Unit 1D
- 791 Lakeside Circle Dr Unit 1
- 705 Lakeside Circle Dr Unit 2
- 1602 Chippewa Trail Unit 21201
- 691 Lakeside Circle Dr
- 1205 E Hintz Rd Unit 201
- 1205 E Hintz Rd Unit 308
- 1205 E Hintz Rd Unit 104
- 1205 E Hintz Rd Unit 19
- 1205 E Hintz Rd Unit 18
- 1205 E Hintz Rd Unit 20
- 1205 E Hintz Rd Unit 11
- 1205 E Hintz Rd Unit 9
- 1205 E Hintz Rd Unit 25
- 1205 E Hintz Rd Unit 3
- 1205 E Hintz Rd Unit 31
- 1205 E Hintz Rd Unit 8
- 1205 E Hintz Rd Unit 15
- 1205 E Hintz Rd Unit 4
- 1205 E Hintz Rd Unit 17
- 1205 E Hintz Rd Unit 30
- 1205 E Hintz Rd Unit 36
- 1205 E Hintz Rd Unit 7
- 1205 E Hintz Rd Unit 21
- 1205 E Hintz Rd Unit 24