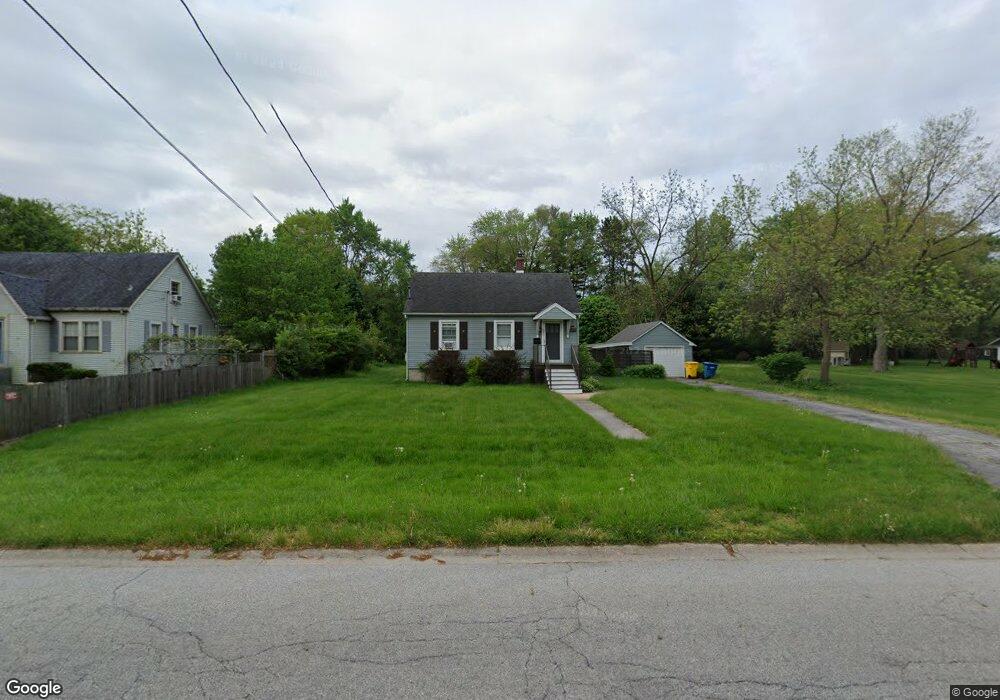
1205 E Lake St Griffith, IN 46319
Estimated Value: $197,371 - $232,000
2
Beds
1
Bath
672
Sq Ft
$320/Sq Ft
Est. Value
About This Home
This home is located at 1205 E Lake St, Griffith, IN 46319 and is currently estimated at $214,843, approximately $319 per square foot. 1205 E Lake St is a home located in Lake County with nearby schools including Griffith Senior High School, St Mary School, and Calumet Christian School.
Ownership History
Date
Name
Owned For
Owner Type
Purchase Details
Closed on
Sep 14, 2020
Sold by
Million Lee Ann
Bought by
Oberg Clifford M
Current Estimated Value
Home Financials for this Owner
Home Financials are based on the most recent Mortgage that was taken out on this home.
Original Mortgage
$137,700
Outstanding Balance
$121,127
Interest Rate
2.8%
Mortgage Type
New Conventional
Estimated Equity
$93,716
Purchase Details
Closed on
May 2, 2016
Sold by
Vanselow Barbara
Bought by
Million Lee Ann
Home Financials for this Owner
Home Financials are based on the most recent Mortgage that was taken out on this home.
Original Mortgage
$102,600
Interest Rate
3.71%
Mortgage Type
New Conventional
Purchase Details
Closed on
May 1, 2009
Sold by
Barringer Jeff W and Barringer Karyn J
Bought by
Vanselow Barbara
Home Financials for this Owner
Home Financials are based on the most recent Mortgage that was taken out on this home.
Original Mortgage
$81,600
Interest Rate
4.85%
Mortgage Type
Purchase Money Mortgage
Create a Home Valuation Report for This Property
The Home Valuation Report is an in-depth analysis detailing your home's value as well as a comparison with similar homes in the area
Home Values in the Area
Average Home Value in this Area
Purchase History
| Date | Buyer | Sale Price | Title Company |
|---|---|---|---|
| Oberg Clifford M | -- | Community Title Company | |
| Million Lee Ann | -- | Community Title Company | |
| Vanselow Barbara | -- | Ticor Title Highland |
Source: Public Records
Mortgage History
| Date | Status | Borrower | Loan Amount |
|---|---|---|---|
| Open | Oberg Clifford M | $137,700 | |
| Previous Owner | Million Lee Ann | $102,600 | |
| Previous Owner | Vanselow Barbara | $81,600 |
Source: Public Records
Tax History
| Year | Tax Paid | Tax Assessment Tax Assessment Total Assessment is a certain percentage of the fair market value that is determined by local assessors to be the total taxable value of land and additions on the property. | Land | Improvement |
|---|---|---|---|---|
| 2025 | $2,391 | $219,700 | $93,000 | $126,700 |
| 2024 | $6,675 | $211,000 | $93,000 | $118,000 |
| 2023 | $2,262 | $203,800 | $93,000 | $110,800 |
| 2022 | $2,262 | $195,600 | $93,000 | $102,600 |
| 2021 | $1,142 | $115,500 | $40,700 | $74,800 |
| 2020 | $1,046 | $109,400 | $40,700 | $68,700 |
| 2019 | $989 | $100,100 | $34,200 | $65,900 |
| 2018 | $794 | $88,200 | $32,600 | $55,600 |
| 2017 | $801 | $88,800 | $32,600 | $56,200 |
| 2016 | $857 | $88,800 | $32,600 | $56,200 |
| 2014 | $792 | $85,300 | $32,600 | $52,700 |
| 2013 | $789 | $83,200 | $32,600 | $50,600 |
Source: Public Records
Map
Nearby Homes
- 310 N Jay St
- 225 N Dwiggins St
- 141 N Dwiggins St
- 139 N Indiana St
- 238 N Indiana St
- 1703 S Fairbanks St
- 706 N Colfax St
- 703 N Glenwood Ave
- 722 N Oakwood St
- 719 N Indiana St
- 408 N Griffith Blvd
- 219 S Broad St
- 415 N Wood St
- 747 N Lafayette St
- 308 S Broad St Unit 12
- 902 N Wood St
- 5420 W 45th St
- 423 N Cline Ave
- 937 N Wood St
- 314 N Cline Ave
- 1115 E Lake St
- 1219 E Lake St
- 1109 E Lake St
- 242 N Colfax St
- 1202 E Lake St
- 1124 E Lake St
- 1206 E Lake St
- 228 N Colfax St
- 231 N Glenwood St
- 222 N Colfax St
- 1116 E Lake St
- 227 N Glenwood St
- 1103 E Lake St
- 216 N Colfax St
- 1104 E Lake St
- 221 N Colfax
- 221 N Colfax St
- 221 N Glenwood Ave
- 210 N Colfax St
- 1100 E Lake St
Your Personal Tour Guide
Ask me questions while you tour the home.