Estimated Value: $378,000 - $427,000
4
Beds
2
Baths
2,198
Sq Ft
$182/Sq Ft
Est. Value
About This Home
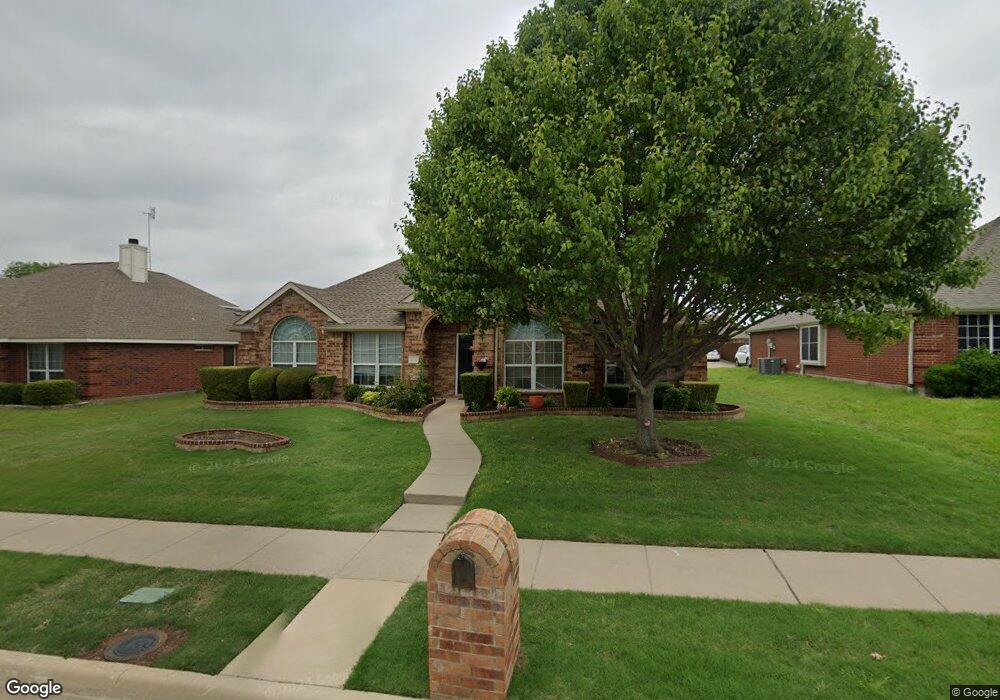
This home is located at 1205 E Oak St, Wylie, TX 75098 and is currently estimated at $400,542, approximately $182 per square foot. 1205 E Oak St is a home located in Collin County with nearby schools including P M Akin Elementary School, AB Harrison Intermediate School, and Grady Burnett J High School.
Ownership History
Date
Name
Owned For
Owner Type
Purchase Details
Closed on
Feb 20, 2008
Sold by
Vrabel Matthew Rynn and Vrabel Heather Kaye
Bought by
Powers Raymond and Powers Evelyn J
Current Estimated Value
Home Financials for this Owner
Home Financials are based on the most recent Mortgage that was taken out on this home.
Original Mortgage
$137,200
Outstanding Balance
$84,807
Interest Rate
5.68%
Mortgage Type
Purchase Money Mortgage
Estimated Equity
$315,735
Purchase Details
Closed on
Feb 10, 2006
Sold by
D R Horton Texas Ltd
Bought by
Vrabel Matthew Ryan and Vrabel Heather Kaye
Home Financials for this Owner
Home Financials are based on the most recent Mortgage that was taken out on this home.
Original Mortgage
$125,600
Interest Rate
7%
Mortgage Type
Fannie Mae Freddie Mac
Create a Home Valuation Report for This Property
The Home Valuation Report is an in-depth analysis detailing your home's value as well as a comparison with similar homes in the area
Home Values in the Area
Average Home Value in this Area
Purchase History
| Date | Buyer | Sale Price | Title Company |
|---|---|---|---|
| Powers Raymond | -- | United Title Of Texas Inc | |
| Vrabel Matthew Ryan | -- | None Available |
Source: Public Records
Mortgage History
| Date | Status | Borrower | Loan Amount |
|---|---|---|---|
| Open | Powers Raymond | $137,200 | |
| Previous Owner | Vrabel Matthew Ryan | $125,600 |
Source: Public Records
Tax History Compared to Growth
Tax History
| Year | Tax Paid | Tax Assessment Tax Assessment Total Assessment is a certain percentage of the fair market value that is determined by local assessors to be the total taxable value of land and additions on the property. | Land | Improvement |
|---|---|---|---|---|
| 2025 | $1,313 | $404,334 | $105,000 | $299,334 |
| 2024 | $1,313 | $373,535 | $105,000 | $292,120 |
| 2023 | $1,313 | $339,577 | $105,000 | $299,202 |
| 2022 | $6,773 | $308,706 | $90,000 | $267,500 |
| 2021 | $6,603 | $283,805 | $65,000 | $218,805 |
| 2020 | $6,335 | $255,129 | $65,000 | $190,129 |
| 2019 | $6,761 | $257,290 | $65,000 | $192,290 |
| 2018 | $6,504 | $241,501 | $55,000 | $186,501 |
| 2017 | $6,011 | $238,069 | $55,000 | $183,069 |
| 2016 | $5,638 | $212,556 | $40,000 | $172,556 |
| 2015 | $3,206 | $187,056 | $40,000 | $147,056 |
Source: Public Records
Map
Nearby Homes
- 107 Windy Knoll Ln
- 1115 Nighthawk Dr
- 1308 London Dr
- 1056 Fairview Dr
- 312 Maltese Cir
- 213 N West A Allen Blvd
- 1209 Surrey Cir
- 407 Sparrow Dr
- 1312 Wyndham Dr
- 205 Duck Blind Ave
- 209 Duck Blind Ave
- 207 Gatwick Ct
- 306 Foxwood Ct
- 211 Rutherford Ave
- 508 Weston St
- 1210 Troy Rd
- 1201 E Stone Rd
- 1320 Cedar Branch Dr
- 409 Cedar Ridge Dr
- 2800 Gold Hill Dr
- 1203 E Oak St
- 1207 E Oak St
- 1209 E Oak St
- 1201 E Oak St
- 1104 Camelot Dr
- 1102 Camelot Dr
- 1106 Camelot Dr
- 1204 E Oak St
- 1202 E Oak St
- 1206 E Oak St
- 1211 E Oak St
- 1100 Camelot Dr
- 1108 Camelot Dr
- 1200 E Oak St
- 1208 E Oak St
- 1110 Camelot Dr
- 1213 E Oak St
- 1210 E Oak St
- 101 N Inverness Way
- 103 N Inverness Way