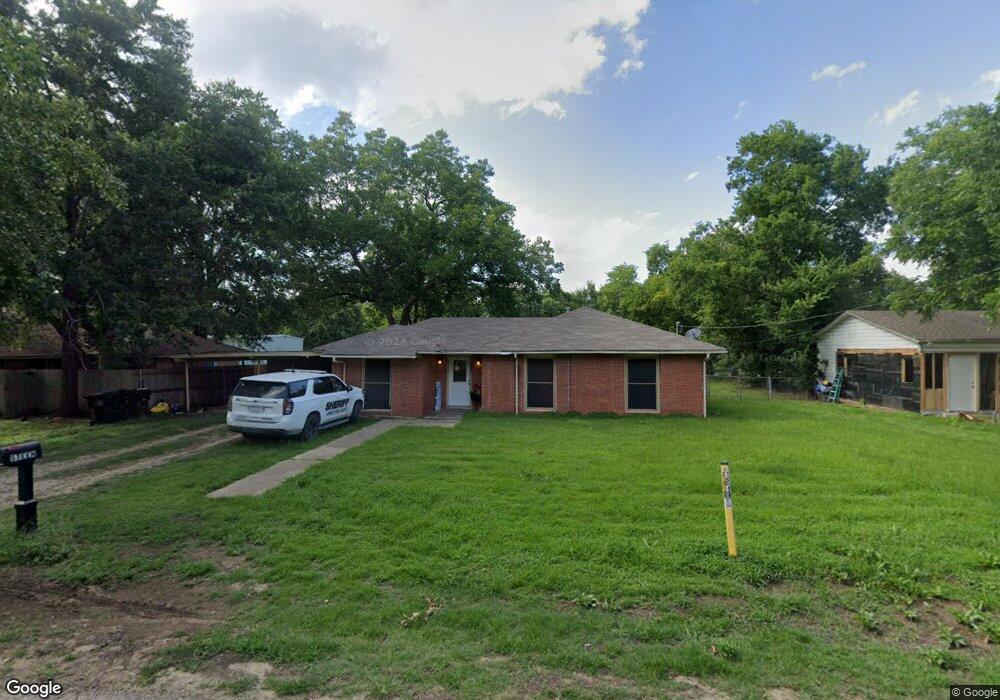
1205 Elm St Teague, SD 75860
Estimated Value: $66,000 - $156,000
--
Bed
2
Baths
1,169
Sq Ft
$97/Sq Ft
Est. Value
About This Home
This home is located at 1205 Elm St, Teague, SD 75860 and is currently estimated at $113,002, approximately $96 per square foot. 1205 Elm St is a home located in Freestone County with nearby schools including Teague Elementary School, Teague Intermediate School, and Teague Junior High School.
Ownership History
Date
Name
Owned For
Owner Type
Purchase Details
Closed on
Nov 16, 2023
Sold by
Thompson Buddie M
Bought by
Thompson Betty H
Current Estimated Value
Purchase Details
Closed on
Apr 21, 2010
Sold by
Vanvanwinkle Shelli Van
Bought by
Shook Jonathan Craig and Shook Mary Robertson
Home Financials for this Owner
Home Financials are based on the most recent Mortgage that was taken out on this home.
Original Mortgage
$57,500
Interest Rate
4.91%
Mortgage Type
Purchase Money Mortgage
Create a Home Valuation Report for This Property
The Home Valuation Report is an in-depth analysis detailing your home's value as well as a comparison with similar homes in the area
Home Values in the Area
Average Home Value in this Area
Purchase History
| Date | Buyer | Sale Price | Title Company |
|---|---|---|---|
| Thompson Betty H | -- | None Listed On Document | |
| Shook Jonathan Craig | -- | -- |
Source: Public Records
Mortgage History
| Date | Status | Borrower | Loan Amount |
|---|---|---|---|
| Previous Owner | Shook Jonathan Craig | $57,500 |
Source: Public Records
Tax History Compared to Growth
Tax History
| Year | Tax Paid | Tax Assessment Tax Assessment Total Assessment is a certain percentage of the fair market value that is determined by local assessors to be the total taxable value of land and additions on the property. | Land | Improvement |
|---|---|---|---|---|
| 2024 | $1,719 | $106,584 | $28,308 | $78,276 |
| 2023 | $1,711 | $98,512 | $20,072 | $78,440 |
| 2022 | $1,670 | $78,531 | $10,000 | $68,531 |
| 2021 | $1,708 | $73,126 | $10,000 | $63,126 |
| 2020 | $1,776 | $65,438 | $7,625 | $57,813 |
| 2019 | $1,132 | $41,262 | $7,625 | $33,637 |
| 2018 | $1,147 | $42,104 | $7,625 | $34,479 |
| 2017 | $1,164 | $42,944 | $7,625 | $35,319 |
| 2016 | $1,061 | $39,114 | $7,625 | $31,489 |
| 2015 | -- | $44,193 | $7,625 | $36,568 |
| 2014 | -- | $42,292 | $7,625 | $34,667 |
Source: Public Records
Map
Nearby Homes