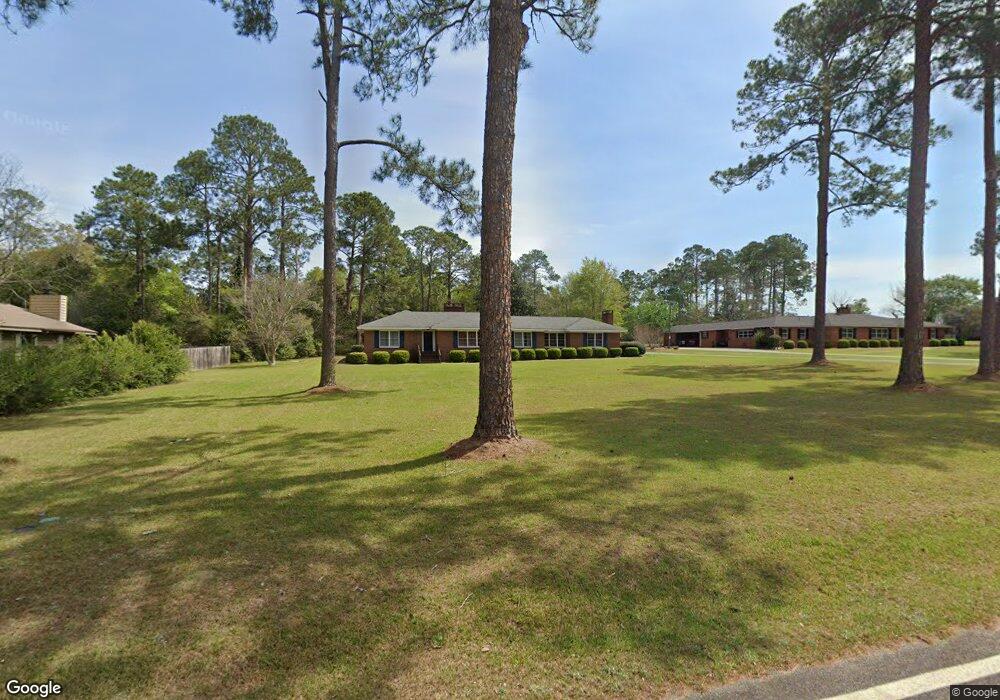
1205 Fleming Rd Cordele, GA 31015
Estimated Value: $307,000 - $340,000
4
Beds
4
Baths
3,896
Sq Ft
$83/Sq Ft
Est. Value
About This Home
This home is located at 1205 Fleming Rd, Cordele, GA 31015 and is currently estimated at $322,667, approximately $82 per square foot. 1205 Fleming Rd is a home located in Crisp County with nearby schools including Crisp County Elementary School, Crisp County Primary School, and Crisp County Middle School.
Ownership History
Date
Name
Owned For
Owner Type
Purchase Details
Closed on
Sep 24, 2018
Sold by
Stone Financing Llc
Bought by
Valdis Daniel
Current Estimated Value
Home Financials for this Owner
Home Financials are based on the most recent Mortgage that was taken out on this home.
Original Mortgage
$166,920
Outstanding Balance
$144,661
Interest Rate
4.5%
Mortgage Type
FHA
Estimated Equity
$178,006
Purchase Details
Closed on
Jul 16, 2018
Sold by
Rice Carol Ann
Bought by
Stone Financing Llc
Purchase Details
Closed on
Sep 28, 2016
Sold by
John T
Bought by
Rice Carol Ann
Purchase Details
Closed on
Jan 1, 2013
Sold by
Williams John T
Bought by
Williams John T
Purchase Details
Closed on
Aug 8, 2012
Sold by
Williams John T
Bought by
Williams John T and Williams Charles Michael
Purchase Details
Closed on
Dec 24, 1989
Bought by
Williams Evelyn W
Purchase Details
Closed on
Sep 15, 1953
Bought by
Williams John T
Create a Home Valuation Report for This Property
The Home Valuation Report is an in-depth analysis detailing your home's value as well as a comparison with similar homes in the area
Purchase History
| Date | Buyer | Sale Price | Title Company |
|---|---|---|---|
| Valdis Daniel | $170,000 | -- | |
| Stone Financing Llc | $163,333 | -- | |
| Rice Carol Ann | $150,000 | -- | |
| Williams John T | $198,000 | -- | |
| Williams John T | -- | -- | |
| Williams Evelyn W | -- | -- | |
| Williams John T | -- | -- |
Source: Public Records
Mortgage History
| Date | Status | Borrower | Loan Amount |
|---|---|---|---|
| Open | Valdis Daniel | $166,920 |
Source: Public Records
Tax History
| Year | Tax Paid | Tax Assessment Tax Assessment Total Assessment is a certain percentage of the fair market value that is determined by local assessors to be the total taxable value of land and additions on the property. | Land | Improvement |
|---|---|---|---|---|
| 2025 | $3,433 | $101,497 | $4,910 | $96,587 |
| 2024 | $3,248 | $92,004 | $4,910 | $87,094 |
| 2023 | $3,219 | $87,258 | $4,910 | $82,348 |
| 2022 | $2,128 | $82,512 | $4,910 | $77,602 |
| 2021 | $2,085 | $77,765 | $9,631 | $68,134 |
| 2020 | $2,133 | $77,765 | $9,631 | $68,134 |
| 2019 | $1,948 | $83,153 | $4,910 | $78,243 |
| 2018 | $2,142 | $74,673 | $7,857 | $66,816 |
| 2017 | $3,032 | $74,673 | $7,857 | $66,816 |
| 2016 | $2,158 | $72,993 | $7,857 | $65,136 |
| 2015 | -- | $72,993 | $7,857 | $65,136 |
| 2014 | -- | $72,993 | $7,857 | $65,136 |
| 2013 | -- | $72,992 | $7,856 | $65,136 |
Source: Public Records
Map
Nearby Homes
- 1206 Fleming Rd
- 912 Rose Ln
- E 8th Ave
- 120 Edgewood Dr
- 1002 Camellia Dr
- 720 E 20th Ave
- 1304 Robin St
- 709 Fleming Rd
- 1001 Stewart Ave
- 716 E 18th Ave
- 1018 E 28th Ave
- 1410 E 24th Ave
- 614 E 26th Ave
- 715 E 17th Ave
- 1509 E 20th Ave
- 618 E 27th Ave
- 1614 Pryor Way
- 615 E 28th Ave
- 1506 E 24th Ave
- 812 E 14th Ave
- 1010 E 22nd Ave
- 1203 Fleming Rd
- 1020 E 22nd Ave
- 1004 E 22nd Ave
- 1209 Fleming Rd
- 1210 S Pecan St
- 1208 Fleming Rd
- 1206 S Pecan St
- 915 Azalea Cir
- 1302 S Pecan St
- 1024 E 22nd Ave
- 1007 E 22nd Ave
- 1003 E 22nd Ave
- 916 Azalea Cir
- 1209 Camellia Dr
- 1017 E 22nd Ave
- 1311 Fleming Rd
- 901 Azalea Cir
- 1207 Camellia Dr
- 1011 E 24th Ave
Your Personal Tour Guide
Ask me questions while you tour the home.