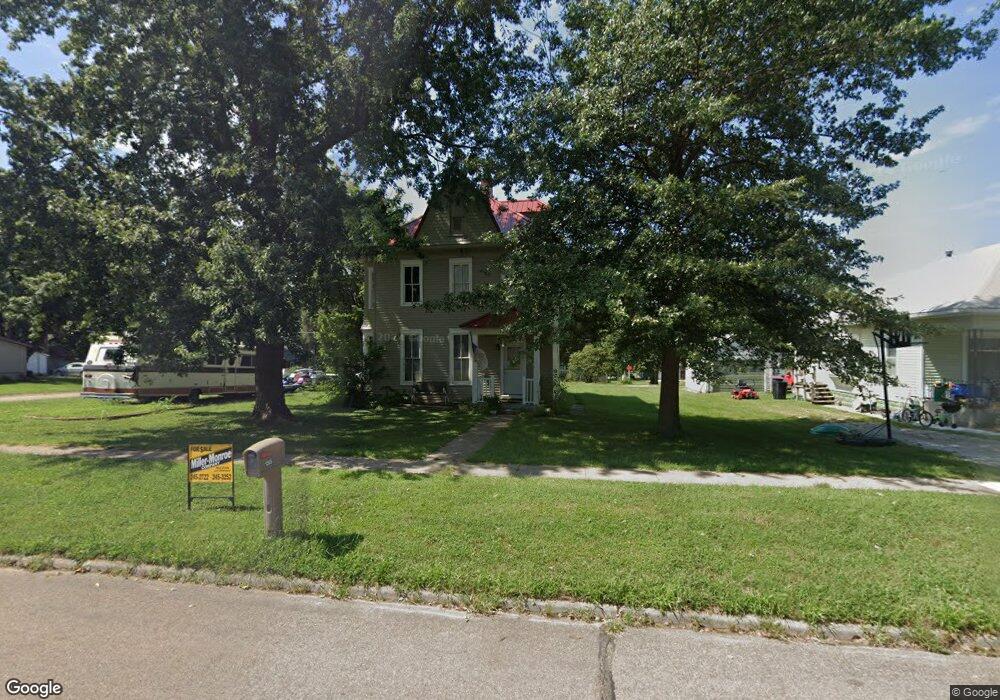
1205 Fulton St Falls City, NE 68355
Estimated Value: $93,281 - $135,000
3
Beds
1
Bath
1,986
Sq Ft
$55/Sq Ft
Est. Value
About This Home
This home is located at 1205 Fulton St, Falls City, NE 68355 and is currently estimated at $109,320, approximately $55 per square foot. 1205 Fulton St is a home located in Richardson County with nearby schools including Falls City North Elementary School, Falls City South Elementary School, and Falls City Middle School.
Ownership History
Date
Name
Owned For
Owner Type
Purchase Details
Closed on
Jan 17, 2025
Sold by
Castellum De Era Llc
Bought by
Vision Homes Llc
Current Estimated Value
Purchase Details
Closed on
Feb 10, 2020
Sold by
Hall Rachael A
Bought by
Vincel Morehead J and Morehead Sharon K
Purchase Details
Closed on
Apr 2, 2015
Sold by
Richardson Cnty Bk & Trust Co
Bought by
Hall Rachael A
Purchase Details
Closed on
Dec 30, 2004
Sold by
Harvalis John and Harvalis Pamela
Bought by
Wilcox Chris
Create a Home Valuation Report for This Property
The Home Valuation Report is an in-depth analysis detailing your home's value as well as a comparison with similar homes in the area
Home Values in the Area
Average Home Value in this Area
Purchase History
| Date | Buyer | Sale Price | Title Company |
|---|---|---|---|
| Vision Homes Llc | $65,000 | -- | |
| Vincel Morehead J | $4,000 | -- | |
| Hall Rachael A | $15,000 | -- | |
| Wilcox Chris | $17,000 | -- |
Source: Public Records
Tax History Compared to Growth
Tax History
| Year | Tax Paid | Tax Assessment Tax Assessment Total Assessment is a certain percentage of the fair market value that is determined by local assessors to be the total taxable value of land and additions on the property. | Land | Improvement |
|---|---|---|---|---|
| 2025 | $676 | $53,192 | $4,125 | $49,067 |
| 2024 | $676 | $50,415 | $4,125 | $46,290 |
| 2023 | $279 | $16,996 | $4,125 | $12,871 |
| 2022 | $293 | $15,255 | $2,835 | $12,420 |
| 2021 | $475 | $25,347 | $2,835 | $22,512 |
| 2020 | $460 | $24,275 | $2,835 | $21,440 |
| 2019 | $455 | $23,651 | $2,835 | $20,816 |
| 2018 | $448 | $23,045 | $2,835 | $20,210 |
| 2017 | $448 | $23,045 | $2,835 | $20,210 |
| 2016 | $435 | $22,456 | $2,835 | $19,621 |
| 2015 | $436 | $22,456 | $2,835 | $19,621 |
| 2014 | $436 | $22,456 | $2,835 | $19,621 |
Source: Public Records
Map
Nearby Homes