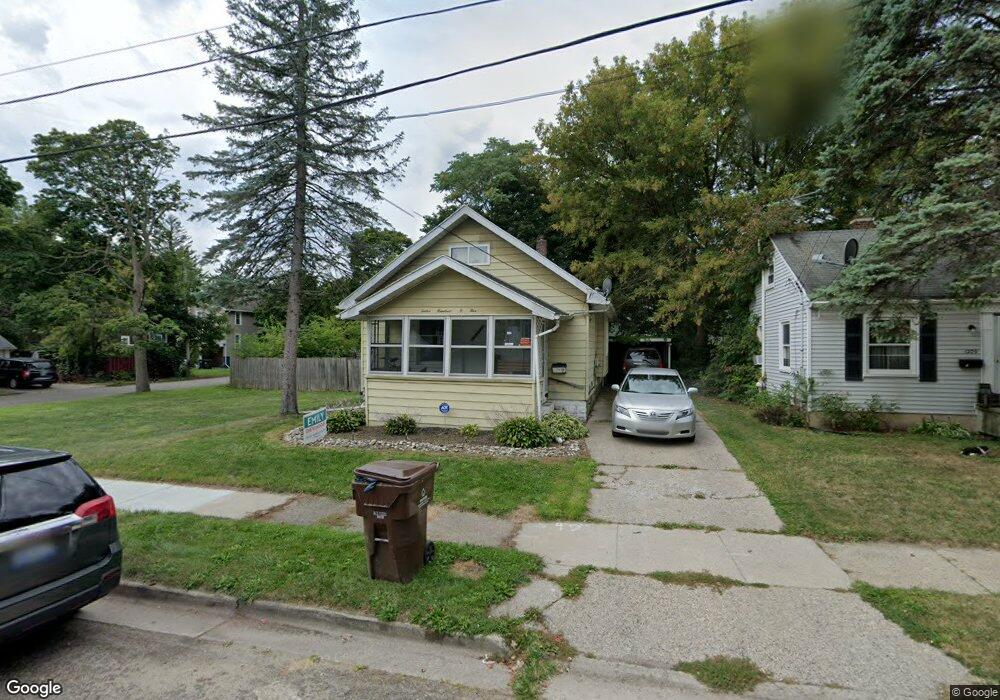
1205 Hapeman St Lansing, MI 48915
Hull Court Park NeighborhoodEstimated Value: $100,477 - $115,000
3
Beds
1
Bath
998
Sq Ft
$107/Sq Ft
Est. Value
About This Home
This home is located at 1205 Hapeman St, Lansing, MI 48915 and is currently estimated at $106,869, approximately $107 per square foot. 1205 Hapeman St is a home located in Ingham County with nearby schools including Willow School, Pattengill Academy, and J.W. Sexton High School.
Ownership History
Date
Name
Owned For
Owner Type
Purchase Details
Closed on
Oct 24, 2008
Sold by
Sonoma Investments Llc
Bought by
Griffin Steven
Current Estimated Value
Purchase Details
Closed on
Jul 17, 2008
Sold by
Kagle Amy
Bought by
Sonoma Investments Llc
Purchase Details
Closed on
Oct 3, 2005
Sold by
Slocum Nesha T and Slocum James Nesha
Bought by
Kagle Amy
Home Financials for this Owner
Home Financials are based on the most recent Mortgage that was taken out on this home.
Original Mortgage
$74,160
Interest Rate
6.37%
Mortgage Type
Fannie Mae Freddie Mac
Purchase Details
Closed on
Aug 28, 2001
Sold by
Hurl Alyson Myckle Lynn and Hurl Toni J
Bought by
James Nesha T
Home Financials for this Owner
Home Financials are based on the most recent Mortgage that was taken out on this home.
Original Mortgage
$66,850
Interest Rate
7.06%
Mortgage Type
FHA
Purchase Details
Closed on
Jun 18, 1998
Sold by
Heartwood '88
Bought by
Hurl Alyson
Purchase Details
Closed on
Apr 29, 1998
Sold by
Hurl Allyson Myckle Lynn
Bought by
Hurl Alyson Myckle Lynn
Create a Home Valuation Report for This Property
The Home Valuation Report is an in-depth analysis detailing your home's value as well as a comparison with similar homes in the area
Home Values in the Area
Average Home Value in this Area
Purchase History
| Date | Buyer | Sale Price | Title Company |
|---|---|---|---|
| Griffin Steven | $27,000 | None Available | |
| Sonoma Investments Llc | $30,000 | None Available | |
| Kagle Amy | $92,700 | None Available | |
| James Nesha T | $67,900 | First American Title Ins Co | |
| Hurl Alyson | -- | -- | |
| Hurl Alyson Myckle Lynn | -- | -- |
Source: Public Records
Mortgage History
| Date | Status | Borrower | Loan Amount |
|---|---|---|---|
| Previous Owner | Kagle Amy | $74,160 | |
| Previous Owner | James Nesha T | $66,850 |
Source: Public Records
Tax History
| Year | Tax Paid | Tax Assessment Tax Assessment Total Assessment is a certain percentage of the fair market value that is determined by local assessors to be the total taxable value of land and additions on the property. | Land | Improvement |
|---|---|---|---|---|
| 2025 | $2,038 | $53,200 | $4,800 | $48,400 |
| 2024 | $16 | $45,500 | $4,800 | $40,700 |
| 2023 | $1,912 | $40,800 | $4,800 | $36,000 |
| 2022 | $1,727 | $35,500 | $5,000 | $30,500 |
| 2021 | $1,691 | $33,900 | $4,500 | $29,400 |
| 2020 | $1,681 | $30,900 | $4,500 | $26,400 |
| 2019 | $2,800 | $29,300 | $4,500 | $24,800 |
| 2018 | $1,510 | $26,000 | $4,500 | $21,500 |
| 2017 | $1,445 | $26,000 | $4,500 | $21,500 |
| 2016 | $2,546 | $25,500 | $4,500 | $21,000 |
| 2015 | $2,546 | $24,300 | $9,055 | $15,245 |
| 2014 | $2,546 | $24,500 | $12,500 | $12,000 |
Source: Public Records
Map
Nearby Homes
- 1624 W Willow St
- 1105 Comfort St
- 1100 Comfort St
- 1348 N Jenison Ave
- 1418 Keeney Ct
- 1310 W Maple St
- 1224 Theodore St
- 1408 Glenrose Ave
- 1218 Linwood St
- 1130 Theodore St
- 1421 Lamont St
- 816 Comfort St
- 1335 N Martin Luther King Junior Blvd
- 821 N Verlinden Ave
- 1527 Robertson Ave
- 1522 Robertson Ave
- 933 N Martin Luther King Junior Blvd
- 1019 Daleford Ave
- 1621 Robertson Ave
- 736 Stanley St
Your Personal Tour Guide
Ask me questions while you tour the home.