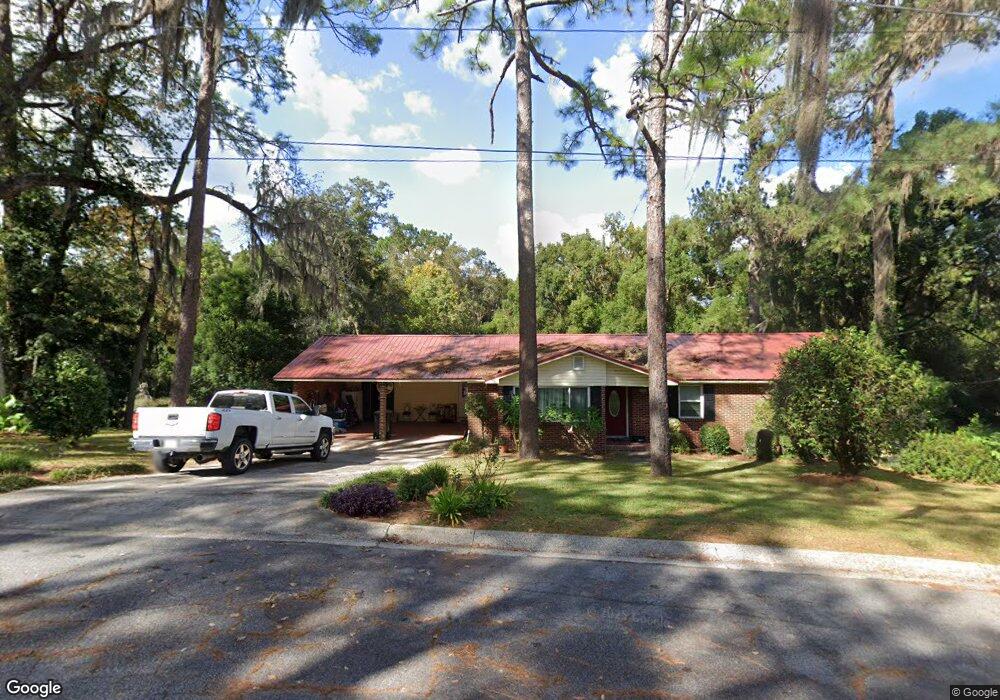
1205 Jasmine Cir Waycross, GA 31501
Estimated Value: $188,000 - $227,000
4
Beds
3
Baths
1,679
Sq Ft
$120/Sq Ft
Est. Value
About This Home
This home is located at 1205 Jasmine Cir, Waycross, GA 31501 and is currently estimated at $201,704, approximately $120 per square foot. 1205 Jasmine Cir is a home located in Ware County with nearby schools including Center Elementary School, Waycross Middle School, and Ware County High School.
Ownership History
Date
Name
Owned For
Owner Type
Purchase Details
Closed on
Jan 17, 2014
Sold by
Britt Suzanne G
Bought by
Britt Bobby W
Current Estimated Value
Home Financials for this Owner
Home Financials are based on the most recent Mortgage that was taken out on this home.
Original Mortgage
$80,000
Outstanding Balance
$60,787
Interest Rate
4.56%
Mortgage Type
New Conventional
Estimated Equity
$140,917
Purchase Details
Closed on
May 29, 2007
Sold by
Britt Suzanne G
Bought by
Britt Bobby W
Purchase Details
Closed on
Jun 7, 1990
Bought by
Bobby Bobby W and Bobby Suzanne G
Purchase Details
Closed on
Mar 23, 1990
Bought by
Associates Relocation
Create a Home Valuation Report for This Property
The Home Valuation Report is an in-depth analysis detailing your home's value as well as a comparison with similar homes in the area
Home Values in the Area
Average Home Value in this Area
Purchase History
| Date | Buyer | Sale Price | Title Company |
|---|---|---|---|
| Britt Bobby W | -- | -- | |
| Britt Bobby W | -- | -- | |
| Bobby Bobby W | $57,000 | -- | |
| Associates Relocation | $69,300 | -- |
Source: Public Records
Mortgage History
| Date | Status | Borrower | Loan Amount |
|---|---|---|---|
| Open | Britt Bobby W | $80,000 |
Source: Public Records
Tax History Compared to Growth
Tax History
| Year | Tax Paid | Tax Assessment Tax Assessment Total Assessment is a certain percentage of the fair market value that is determined by local assessors to be the total taxable value of land and additions on the property. | Land | Improvement |
|---|---|---|---|---|
| 2024 | $1,208 | $84,879 | $8,820 | $76,059 |
| 2023 | $1,233 | $64,060 | $4,752 | $59,308 |
| 2022 | $1,411 | $64,060 | $4,752 | $59,308 |
| 2021 | $1,462 | $51,468 | $4,752 | $46,716 |
| 2020 | $1,473 | $51,468 | $4,752 | $46,716 |
| 2019 | $1,494 | $39,102 | $4,752 | $34,350 |
| 2018 | $1,508 | $37,728 | $4,752 | $32,976 |
| 2017 | $1,472 | $37,728 | $4,752 | $32,976 |
| 2016 | $1,472 | $37,728 | $4,752 | $32,976 |
| 2015 | $1,483 | $37,728 | $4,752 | $32,976 |
| 2014 | $1,481 | $37,728 | $4,752 | $32,976 |
| 2013 | -- | $37,728 | $4,752 | $32,976 |
Source: Public Records
Map
Nearby Homes
- 1206 Morningside Dr
- 1703 Rainbow Dr
- 1621 Camellia Dr
- 1715 City Blvd
- 1103 Kontz Ave
- Lot 3 City Blvd
- 2108 Screven Ave
- 1617 Moss Creek Rd
- 1400 E Cherokee Dr
- 1011 Cherokee Cir
- 1622 Booth St
- 00 Seminole Trail
- 1002 Cherokee Cir
- 1502 Seminole Trail
- 1504 Danora Dr
- 2706 Alice St
- 404 Community Dr
- 1001 Coral Rd
- 1009 Euclid Ave
- 1100 Euclid Ave
- 1207 Jasmine Cir
- 1206 Jasmine Cir
- 1115 Morningside Dr
- 1209 Jasmine Cir
- 1201 Morningside Dr
- 1212 Jasmine Cir
- 1203 Morningside Dr
- 1021 Morningside Dr
- 1213 Jasmine Cir
- 1207 Morningside Dr
- 1116 Morningside Dr
- 1114 Morningside Dr
- 1200 Morningside Dr
- 1110 Morningside Dr
- 1302 Jasmine Cir
- 1209 Morningside Dr
- 1208 Morningside Dr
- 0 Morningside Dr Unit 7463695
- 0 Morningside Dr Unit 7488746
- 0 Morningside Dr