Estimated Value: $212,000 - $224,000
3
Beds
2
Baths
1,562
Sq Ft
$140/Sq Ft
Est. Value
About This Home
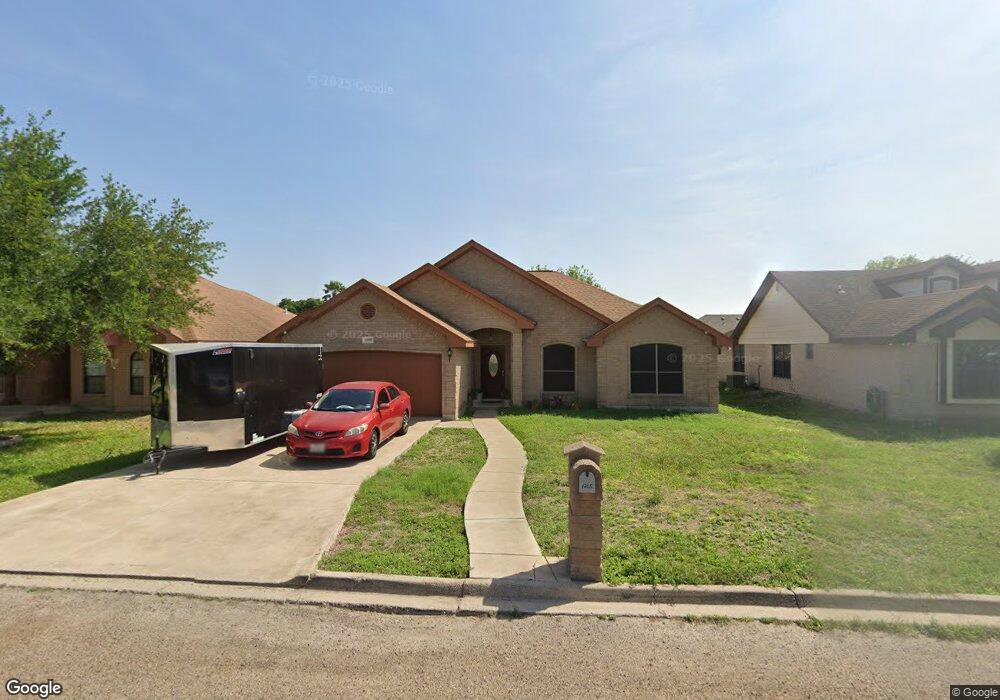
This home is located at 1205 Maple, Alamo, TX 78516 and is currently estimated at $219,265, approximately $140 per square foot. 1205 Maple is a home located in Hidalgo County with nearby schools including John McKeever Elementary, Jesus "Jesse" Vela Jr. Middle School, and PSJA Memorial Early College High School.
Ownership History
Date
Name
Owned For
Owner Type
Purchase Details
Closed on
Jan 7, 2021
Sold by
Guerra Luciano and Nerio Sulema
Bought by
Guerra David and Guerra Amoldo
Current Estimated Value
Purchase Details
Closed on
Mar 13, 2007
Sold by
P E P Investments Ltd
Bought by
Guerra David and Guerra Maria Ofelia
Home Financials for this Owner
Home Financials are based on the most recent Mortgage that was taken out on this home.
Original Mortgage
$16,700
Interest Rate
6.3%
Mortgage Type
Purchase Money Mortgage
Create a Home Valuation Report for This Property
The Home Valuation Report is an in-depth analysis detailing your home's value as well as a comparison with similar homes in the area
Home Values in the Area
Average Home Value in this Area
Purchase History
| Date | Buyer | Sale Price | Title Company |
|---|---|---|---|
| Guerra David | -- | None Available | |
| Guerra David | -- | Sierra Title |
Source: Public Records
Mortgage History
| Date | Status | Borrower | Loan Amount |
|---|---|---|---|
| Previous Owner | Guerra David | $16,700 |
Source: Public Records
Tax History
| Year | Tax Paid | Tax Assessment Tax Assessment Total Assessment is a certain percentage of the fair market value that is determined by local assessors to be the total taxable value of land and additions on the property. | Land | Improvement |
|---|---|---|---|---|
| 2025 | $3,181 | $183,547 | -- | -- |
| 2024 | $3,181 | $166,861 | -- | -- |
| 2023 | $3,781 | $151,692 | $0 | $0 |
| 2022 | $3,681 | $137,902 | $0 | $0 |
| 2021 | $3,411 | $125,365 | $32,813 | $109,054 |
| 2020 | $3,142 | $113,968 | $22,813 | $91,155 |
| 2019 | $3,094 | $108,056 | $20,000 | $88,056 |
| 2018 | $3,113 | $109,042 | $20,000 | $89,042 |
| 2017 | $3,263 | $112,529 | $22,500 | $90,029 |
| 2016 | $3,137 | $108,204 | $17,188 | $91,016 |
| 2015 | $2,737 | $109,191 | $17,188 | $92,003 |
Source: Public Records
Map
Nearby Homes
Your Personal Tour Guide
Ask me questions while you tour the home.