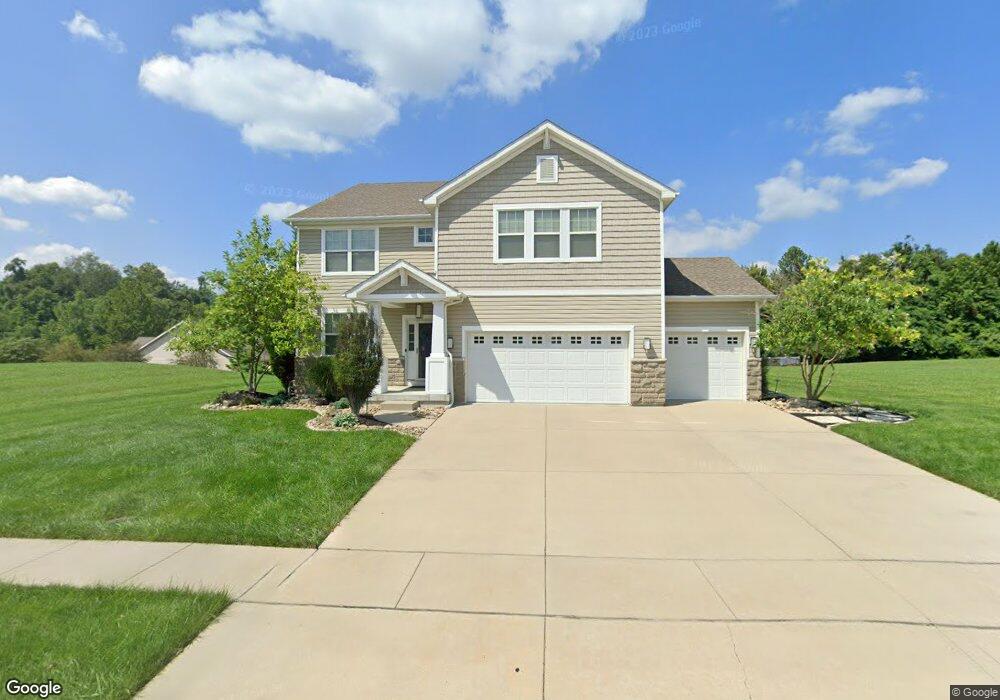
1205 Merriam Pkwy O Fallon, IL 62269
Estimated Value: $473,000 - $520,000
--
Bed
--
Bath
1,812
Sq Ft
$277/Sq Ft
Est. Value
About This Home
This home is located at 1205 Merriam Pkwy, O Fallon, IL 62269 and is currently estimated at $502,004, approximately $277 per square foot. 1205 Merriam Pkwy is a home located in St. Clair County with nearby schools including Schaefer Elementary School, Fulton Junior High School, and O'Fallon Township High School.
Ownership History
Date
Name
Owned For
Owner Type
Purchase Details
Closed on
Nov 18, 2010
Sold by
Pulte Homes Of St Louis Llc
Bought by
Martinez James P and Martinez Amanda G
Current Estimated Value
Home Financials for this Owner
Home Financials are based on the most recent Mortgage that was taken out on this home.
Original Mortgage
$191,051
Outstanding Balance
$126,053
Interest Rate
4.27%
Mortgage Type
New Conventional
Estimated Equity
$375,951
Purchase Details
Closed on
Apr 27, 2010
Sold by
Bank Of America Na
Bought by
Huntington Chase Corporation
Purchase Details
Closed on
Apr 23, 2010
Sold by
Huntington Chase Corporation
Bought by
Pulte Homes Of St Louis Llc
Purchase Details
Closed on
Feb 17, 2010
Sold by
Mayer Custom Homes Inc
Bought by
Bank Of America Na
Create a Home Valuation Report for This Property
The Home Valuation Report is an in-depth analysis detailing your home's value as well as a comparison with similar homes in the area
Home Values in the Area
Average Home Value in this Area
Purchase History
| Date | Buyer | Sale Price | Title Company |
|---|---|---|---|
| Martinez James P | $381,000 | Pgp Title | |
| Huntington Chase Corporation | $910,000 | Advanced Title Solutions Inc | |
| Pulte Homes Of St Louis Llc | $987,000 | Commerce Title Company | |
| Bank Of America Na | -- | Benchmark Title Company |
Source: Public Records
Mortgage History
| Date | Status | Borrower | Loan Amount |
|---|---|---|---|
| Open | Martinez James P | $191,051 |
Source: Public Records
Tax History Compared to Growth
Tax History
| Year | Tax Paid | Tax Assessment Tax Assessment Total Assessment is a certain percentage of the fair market value that is determined by local assessors to be the total taxable value of land and additions on the property. | Land | Improvement |
|---|---|---|---|---|
| 2024 | $10,674 | $155,630 | $35,041 | $120,589 |
| 2023 | $9,920 | $137,701 | $31,004 | $106,697 |
| 2022 | $9,419 | $129,286 | $30,386 | $98,900 |
| 2021 | $9,090 | $122,709 | $28,840 | $93,869 |
| 2020 | $9,034 | $116,237 | $27,319 | $88,918 |
| 2019 | $8,818 | $116,237 | $27,319 | $88,918 |
| 2018 | $7,242 | $95,954 | $21,571 | $74,383 |
| 2017 | $3,595 | $92,060 | $20,695 | $71,365 |
| 2016 | $7,164 | $89,982 | $20,228 | $69,754 |
| 2014 | $6,736 | $90,227 | $20,470 | $69,757 |
| 2013 | $2,100 | $91,890 | $20,847 | $71,043 |
Source: Public Records
Map
Nearby Homes
- 1204 Waldman Ct
- 509 Longfellow Dr
- 721 Milburn School Rd
- 1240 Pausch Rd Unit 6.65 ac
- 1240 Pausch Rd
- 1240 Pausch Rd Unit 39.72 ac
- 641 Ambrose Dr
- 829 Bushwood Way
- 837 Bushwood Way
- 663 Tea Olive Blvd
- 605 Monarch Dr
- 805 Golden Bell Ln
- 8000 Nolan St
- 616 Middletown Ct
- 817 Golden Bell Ln
- 804 Green Jacket Way
- 812 Green Jacket Way
- 609 Tea Olive Blvd
- 1435 Gambier Terrace Ct
- 853 Bassett St
- 1209 Merriam Pkwy
- 604 Longfellow Dr
- 600 Longfellow Dr
- 1213 Merriam Pkwy
- 1217 Merriam Pkwy
- 541 Frost Ct
- 524 Longfellow Dr
- 540 Frost Ct
- 608 Longfellow Dr
- 608 Longfellow Dr
- 1221 Merriam Pkwy
- 1133 Merriam Pkwy
- 1212 Merriam Pkwy
- 537 Frost Ct
- 601 Longfellow Dr
- 520 Longfellow Dr
- 1216 Merriam Pkwy
- 1225 Merriam Pkwy
- 1232 Merriam Pkwy
- 1201 Waldman Ct