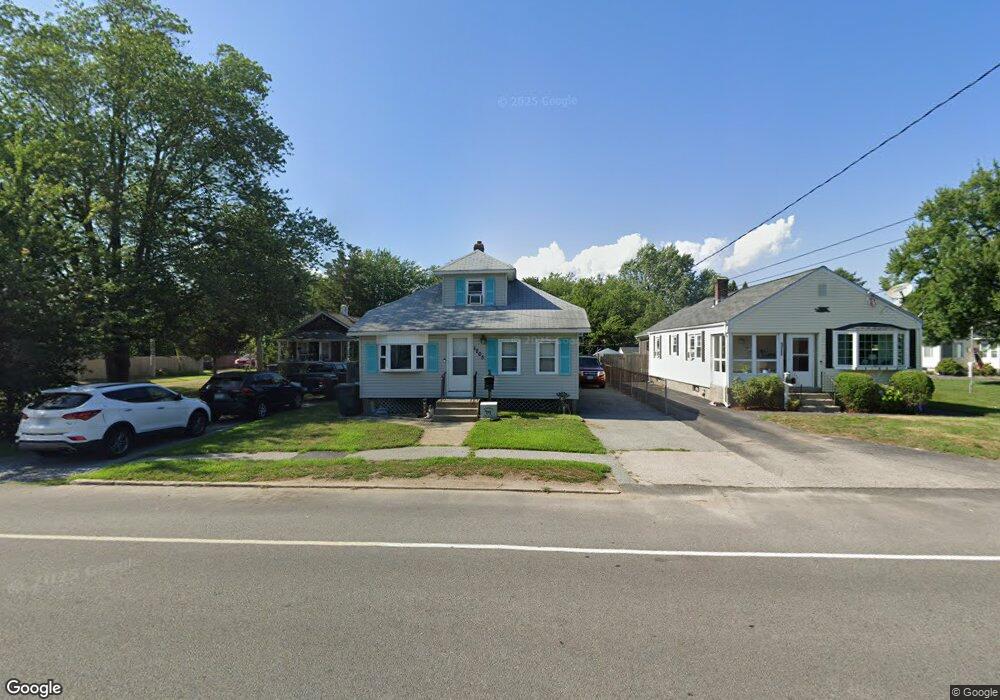
1205 Narragansett Pkwy Warwick, RI 02888
Palace Garden NeighborhoodEstimated Value: $395,000 - $453,000
3
Beds
1
Bath
1,020
Sq Ft
$417/Sq Ft
Est. Value
About This Home
This home is located at 1205 Narragansett Pkwy, Warwick, RI 02888 and is currently estimated at $425,263, approximately $416 per square foot. 1205 Narragansett Pkwy is a home located in Kent County with nearby schools including St. Peter School and Saint Paul School.
Ownership History
Date
Name
Owned For
Owner Type
Purchase Details
Closed on
Jul 23, 2021
Sold by
Roberts Julie A
Bought by
Salvato Thomas
Current Estimated Value
Home Financials for this Owner
Home Financials are based on the most recent Mortgage that was taken out on this home.
Original Mortgage
$265,109
Outstanding Balance
$239,728
Interest Rate
2.96%
Mortgage Type
FHA
Estimated Equity
$185,535
Purchase Details
Closed on
Mar 14, 2001
Sold by
Savastano Jason T and Savastano Tammy L
Bought by
Whitney Julie A and Whitney Kevin R
Purchase Details
Closed on
Feb 14, 1997
Sold by
Fallon Connetta M
Bought by
Savastano Jason T and Savastano Tammy
Purchase Details
Closed on
Apr 26, 1989
Sold by
Cook Craig
Bought by
Rudnicki Connetta M
Create a Home Valuation Report for This Property
The Home Valuation Report is an in-depth analysis detailing your home's value as well as a comparison with similar homes in the area
Home Values in the Area
Average Home Value in this Area
Purchase History
| Date | Buyer | Sale Price | Title Company |
|---|---|---|---|
| Salvato Thomas | $270,000 | None Available | |
| Whitney Julie A | $89,000 | -- | |
| Savastano Jason T | $78,000 | -- | |
| Rudnicki Connetta M | $89,000 | -- | |
| Rudnicki Connetta M | $89,000 | -- |
Source: Public Records
Mortgage History
| Date | Status | Borrower | Loan Amount |
|---|---|---|---|
| Open | Salvato Thomas | $265,109 | |
| Previous Owner | Rudnicki Connetta M | $191,550 | |
| Previous Owner | Rudnicki Connetta M | $160,000 | |
| Previous Owner | Rudnicki Connetta M | $129,412 |
Source: Public Records
Tax History Compared to Growth
Tax History
| Year | Tax Paid | Tax Assessment Tax Assessment Total Assessment is a certain percentage of the fair market value that is determined by local assessors to be the total taxable value of land and additions on the property. | Land | Improvement |
|---|---|---|---|---|
| 2025 | $5,509 | $433,800 | $112,500 | $321,300 |
| 2024 | $4,746 | $328,000 | $97,800 | $230,200 |
| 2023 | $4,654 | $328,000 | $97,800 | $230,200 |
| 2022 | $4,388 | $234,300 | $62,300 | $172,000 |
| 2021 | $4,388 | $234,300 | $62,300 | $172,000 |
| 2020 | $4,388 | $234,300 | $62,300 | $172,000 |
| 2019 | $4,388 | $234,300 | $62,300 | $172,000 |
| 2018 | $3,635 | $179,600 | $62,300 | $117,300 |
| 2017 | $3,635 | $179,600 | $62,300 | $117,300 |
| 2016 | $3,635 | $179,600 | $62,300 | $117,300 |
| 2015 | $3,268 | $157,500 | $54,800 | $102,700 |
| 2014 | $3,159 | $157,500 | $54,800 | $102,700 |
| 2013 | $3,117 | $157,500 | $54,800 | $102,700 |
Source: Public Records
Map
Nearby Homes
- 23 Stoddard Place
- 63 Benbridge Ave
- 110 Pilgrim Pkwy Unit 8
- 40 Easton Ave
- 117 Spring Green Rd
- 93 Easton Ave
- 845 Warwick Ave
- 161 N Country Club Dr
- 922 Narragansett Pkwy
- 111 Aster St
- 56 Errol St
- 12 Stanford St
- 6 Black Creek Ln
- 169 Partition St
- 196 Harrison Ave
- 126 Fairfax Dr
- 165 Merrymount Dr
- 72 W Shore Rd Unit 3
- 72 W Shore Rd Unit 104
- 25 Honeysuckle Rd
- 1209 Narragansett Pkwy
- 1201 Narragansett Pkwy
- 1218 Narragansett Pkwy
- 1219 Narragansett Pkwy
- 1210 Narragansett Pkwy
- 1213 Narragansett Pkwy
- 1195 Narragansett Pkwy
- 1194 Narragansett Pkwy
- 1200 Narragansett Pkwy
- 1183 Narragansett Pkwy
- 1189 Narragansett Pkwy
- 11 Cread Place
- 1227 Narragansett Pkwy
- 22 Cooke Place
- 14 Cooke Place
- 10 Cooke Place
- 60 Dawson Ave
- 1177 Narragansett Pkwy
- 1 Thayer Place
- 16 Cread Place