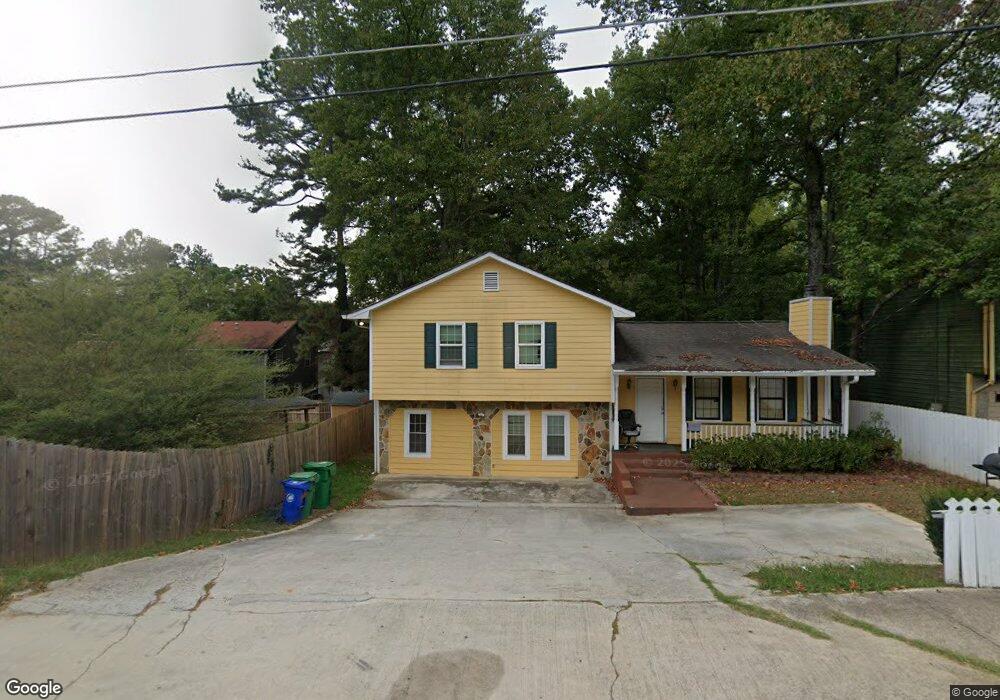
1205 Panola Rd Unit 1 Stone Mountain, GA 30088
Estimated Value: $254,000 - $296,000
3
Beds
2
Baths
1,354
Sq Ft
$203/Sq Ft
Est. Value
About This Home
This home is located at 1205 Panola Rd Unit 1, Stone Mountain, GA 30088 and is currently estimated at $275,100, approximately $203 per square foot. 1205 Panola Rd Unit 1 is a home located in DeKalb County with nearby schools including Shadow Rock Elementary School, Redan Middle School, and Redan High School.
Ownership History
Date
Name
Owned For
Owner Type
Purchase Details
Closed on
Sep 24, 2024
Sold by
Psatl141 1205 Panola Rd Llc
Bought by
Vivid Homes Llc
Current Estimated Value
Home Financials for this Owner
Home Financials are based on the most recent Mortgage that was taken out on this home.
Original Mortgage
$189,000
Outstanding Balance
$186,871
Interest Rate
6.46%
Mortgage Type
New Conventional
Estimated Equity
$88,229
Purchase Details
Closed on
Jul 31, 2018
Sold by
Smith Benita
Bought by
Rosado Santos and Rosado Selenia
Home Financials for this Owner
Home Financials are based on the most recent Mortgage that was taken out on this home.
Original Mortgage
$118,808
Interest Rate
5.12%
Mortgage Type
FHA
Purchase Details
Closed on
Sep 2, 1997
Sold by
Tyson John W and Tyson Ruth D
Bought by
Alliance Mortgage Co
Purchase Details
Closed on
Mar 24, 1995
Sold by
Tyson John W Ruth D
Bought by
Thorpe James B
Create a Home Valuation Report for This Property
The Home Valuation Report is an in-depth analysis detailing your home's value as well as a comparison with similar homes in the area
Home Values in the Area
Average Home Value in this Area
Purchase History
| Date | Buyer | Sale Price | Title Company |
|---|---|---|---|
| Vivid Homes Llc | -- | -- | |
| Rosado Santos | $121,000 | -- | |
| Alliance Mortgage Co | $70,391 | -- | |
| Thorpe James B | $15,500 | -- |
Source: Public Records
Mortgage History
| Date | Status | Borrower | Loan Amount |
|---|---|---|---|
| Open | Vivid Homes Llc | $189,000 | |
| Previous Owner | Rosado Santos | $118,808 | |
| Previous Owner | Rosado Santos | $28,000 | |
| Closed | Thorpe James B | $0 |
Source: Public Records
Tax History Compared to Growth
Tax History
| Year | Tax Paid | Tax Assessment Tax Assessment Total Assessment is a certain percentage of the fair market value that is determined by local assessors to be the total taxable value of land and additions on the property. | Land | Improvement |
|---|---|---|---|---|
| 2025 | $5,066 | $106,240 | $10,800 | $95,440 |
| 2024 | $4,628 | $96,240 | $5,600 | $90,640 |
| 2023 | $4,628 | $75,480 | $5,600 | $69,880 |
| 2022 | $3,413 | $70,640 | $5,600 | $65,040 |
| 2021 | $1,480 | $45,440 | $5,600 | $39,840 |
| 2020 | $1,165 | $36,160 | $5,600 | $30,560 |
| 2019 | $1,178 | $36,840 | $5,600 | $31,240 |
| 2018 | $769 | $36,760 | $5,600 | $31,160 |
| 2017 | $1,030 | $31,640 | $5,600 | $26,040 |
| 2016 | $920 | $29,160 | $5,600 | $23,560 |
| 2014 | $373 | $13,000 | $5,460 | $7,540 |
Source: Public Records
Map
Nearby Homes
- 1179 Panola Rd
- 5435 Brandon Ct
- 5526 Redan Rd
- 5472 Forest East Ln
- 1093 Panola Rd
- 5406 Megan Rd
- 5330 Tracey Dr
- 5323 Tracey Dr
- 1017 Forest West Ct
- 1037 Forest Path Unit 3B
- 1175 Muirfield Dr
- 1144 Redan Trace
- 5266 Long Green Ln Unit 2
- 5521 Joeclay Dr
- 5471 Fox Valley Ln Unit 10
- 5219 Sweet Air Ln
- 1040 Redan Trace
- 5216 Sweet Air Ln
- 5599 Redan Cir
- 870 Chapman Cir
- 1205 Panola Rd
- 1199 Panola Rd
- 5468 Brandon Ct
- 5462 Brandon Ct
- 5454 Brandon Ct
- 1193 Panola Rd
- 5446 Brandon Ct
- 5440 Brandon Ct
- 1185 Panola Rd
- 1200 Panola Rd
- 1208 Panola Rd
- 5467 Brandon Ct
- 1216 Panola Rd
- 1200 Panola Aroad
- 5463 Brandon Ct
- 1190 Panola Rd
- 5438 Brandon Ct
- 5451 Brandon Ct
- 5455 Brandon Ct
- 5459 Brandon Ct