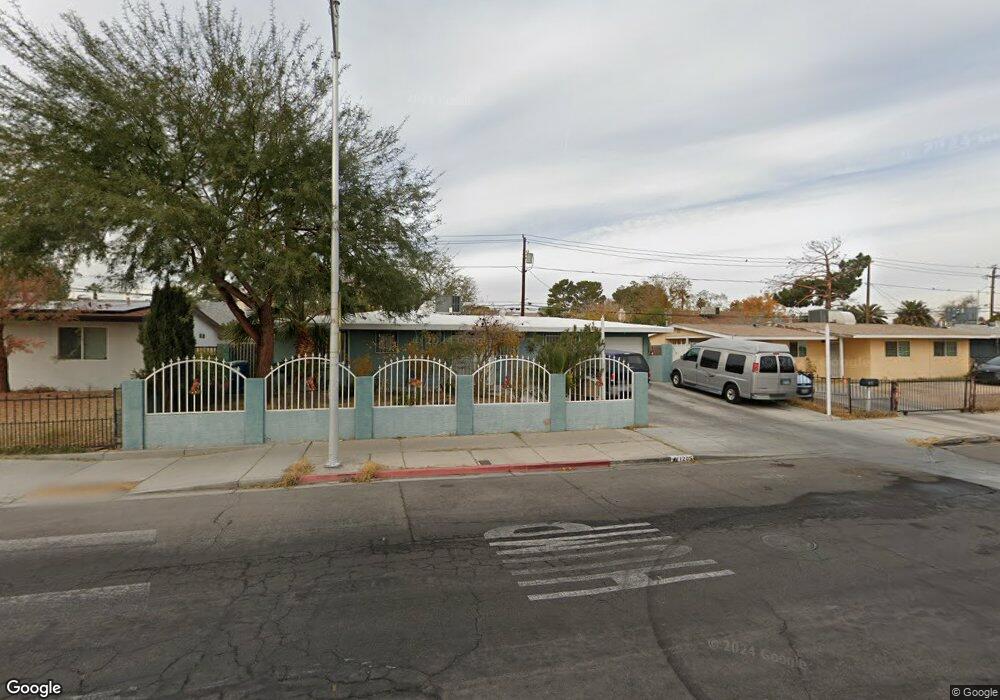
1205 Pyramid Dr Las Vegas, NV 89108
Twin Lakes NeighborhoodEstimated Value: $293,000 - $327,000
3
Beds
2
Baths
1,060
Sq Ft
$293/Sq Ft
Est. Value
About This Home
This home is located at 1205 Pyramid Dr, Las Vegas, NV 89108 and is currently estimated at $310,148, approximately $292 per square foot. 1205 Pyramid Dr is a home located in Clark County with nearby schools including Twin Lakes Elementary School, Robert O Gibson Middle School, and Western High School.
Ownership History
Date
Name
Owned For
Owner Type
Purchase Details
Closed on
Aug 8, 2016
Sold by
Ulloa Jose and Ulloa Rosa Macias De
Bought by
Ulloa Jose and Ulloa Rosa Macias De
Current Estimated Value
Home Financials for this Owner
Home Financials are based on the most recent Mortgage that was taken out on this home.
Original Mortgage
$68,400
Interest Rate
3.45%
Mortgage Type
New Conventional
Purchase Details
Closed on
Sep 20, 2000
Sold by
Sky J Enterprises Llc
Bought by
Ulloa Jose and Macias Rosa
Home Financials for this Owner
Home Financials are based on the most recent Mortgage that was taken out on this home.
Original Mortgage
$96,662
Interest Rate
7.98%
Mortgage Type
FHA
Purchase Details
Closed on
Mar 20, 2000
Sold by
Pang Francis
Bought by
Sky J Enterprises Llc
Purchase Details
Closed on
Jul 9, 1999
Sold by
Pang Marcella
Bought by
Pang Francis
Purchase Details
Closed on
Jul 7, 1999
Sold by
Hud
Bought by
Pang Francis
Purchase Details
Closed on
May 13, 1998
Sold by
Dillow Toni and Dillow Basil H
Bought by
Chase Manhattan Mtg Corp
Purchase Details
Closed on
Jan 6, 1998
Sold by
Chase Manhattan Mtg Corp
Bought by
Hud
Create a Home Valuation Report for This Property
The Home Valuation Report is an in-depth analysis detailing your home's value as well as a comparison with similar homes in the area
Home Values in the Area
Average Home Value in this Area
Purchase History
| Date | Buyer | Sale Price | Title Company |
|---|---|---|---|
| Ulloa Jose | -- | Service Link | |
| Ulloa Jose | $103,000 | Ati Title | |
| Sky J Enterprises Llc | -- | -- | |
| Pang Francis | -- | Stewart Title | |
| Pang Francis | -- | Stewart Title | |
| Chase Manhattan Mtg Corp | $70,329 | Land Title | |
| Hud | -- | Land Title |
Source: Public Records
Mortgage History
| Date | Status | Borrower | Loan Amount |
|---|---|---|---|
| Previous Owner | Ulloa Jose | $68,400 | |
| Previous Owner | Ulloa Jose | $96,662 |
Source: Public Records
Tax History Compared to Growth
Tax History
| Year | Tax Paid | Tax Assessment Tax Assessment Total Assessment is a certain percentage of the fair market value that is determined by local assessors to be the total taxable value of land and additions on the property. | Land | Improvement |
|---|---|---|---|---|
| 2025 | $579 | $43,292 | $28,000 | $15,292 |
| 2024 | $563 | $43,292 | $28,000 | $15,292 |
| 2023 | $430 | $43,244 | $29,400 | $13,844 |
| 2022 | $599 | $36,145 | $23,800 | $12,345 |
| 2021 | $555 | $32,505 | $21,000 | $11,505 |
| 2020 | $512 | $32,174 | $21,000 | $11,174 |
| 2019 | $480 | $27,224 | $16,450 | $10,774 |
| 2018 | $458 | $25,165 | $15,050 | $10,115 |
| 2017 | $765 | $23,326 | $13,300 | $10,026 |
| 2016 | $430 | $18,418 | $8,750 | $9,668 |
| 2015 | $428 | $15,328 | $5,950 | $9,378 |
| 2014 | $416 | $12,300 | $4,900 | $7,400 |
Source: Public Records
Map
Nearby Homes
- 1317 Pyramid Dr
- 1112 Hazard Ave
- 1325 Pyramid Dr
- 812 Pyramid Dr
- 1300 Oak Tree Ln
- 3616 Roseglen Ct
- 821 Mar Jay Ct
- 1313 Purple Sage Ave
- 1101 Silver Lake Dr
- 800 Langtry Dr
- 3871 Mountain Trail
- 1225 Arrowhead Ave
- 1204 Arrowhead Ave
- 3541 Arcadian Sea St
- 3621 Arcadian Sea St
- 1103 Arrowhead Ave
- 3541 Alpheus River Ave
- 3537 Alpheus River Ave
- 3534 Alpheus River Ave
- 812 Hogan Dr
- 1209 Pyramid Dr
- 1201 Pyramid Dr
- 1108 Woodbridge Dr
- 1112 Woodbridge Dr
- 1104 Woodbridge Dr
- 1213 Pyramid Dr
- 1113 Pyramid Dr
- 1116 Woodbridge Dr
- 3518 Navajo Way
- 1100 Woodbridge Dr
- 1200 Pyramid Dr Unit 2
- 1217 Pyramid Dr
- 1109 Pyramid Dr
- 1112 Pyramid Dr
- 1120 Woodbridge Dr
- 1020 Woodbridge Dr
- 3514 Navajo Way
- 3513 Turquoise Rd
- 1108 Pyramid Dr Unit 2
- 1105 Woodbridge Dr