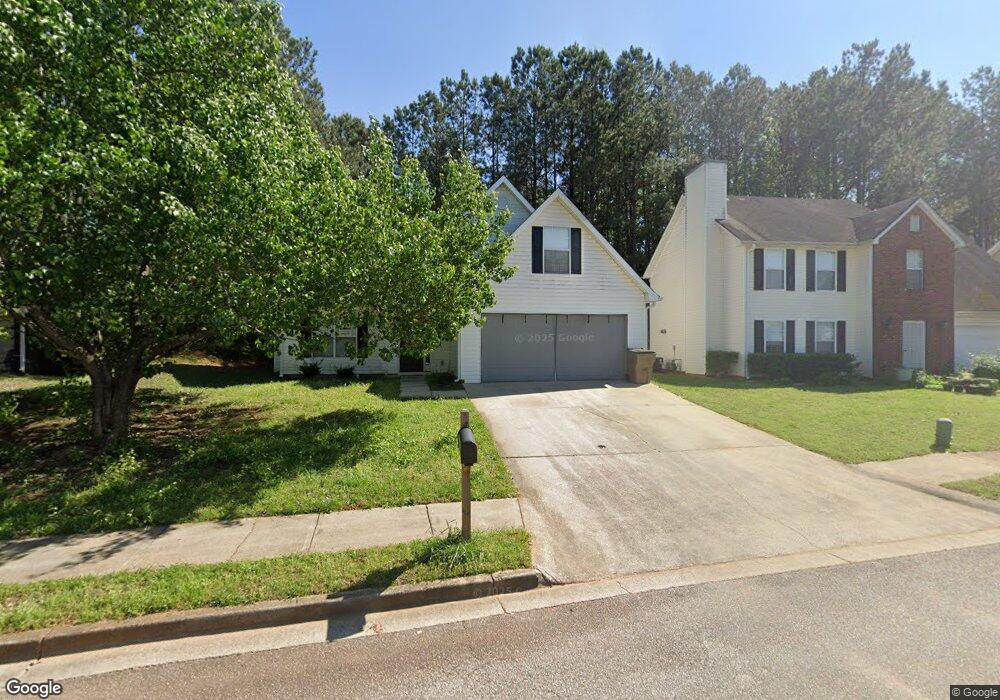
1205 Redbud Ct McDonough, GA 30253
Estimated Value: $242,000 - $292,000
4
Beds
3
Baths
1,801
Sq Ft
$148/Sq Ft
Est. Value
About This Home
This home is located at 1205 Redbud Ct, McDonough, GA 30253 and is currently estimated at $267,213, approximately $148 per square foot. 1205 Redbud Ct is a home located in Henry County with nearby schools including Flippen Elementary School, Eagle's Landing Middle School, and Eagle's Landing High School.
Ownership History
Date
Name
Owned For
Owner Type
Purchase Details
Closed on
Oct 18, 2021
Sold by
Beauford Carol A
Bought by
Progress Atlanta Llc
Current Estimated Value
Purchase Details
Closed on
Sep 11, 2007
Sold by
Davis Lynette
Bought by
Beauford Carol A
Home Financials for this Owner
Home Financials are based on the most recent Mortgage that was taken out on this home.
Original Mortgage
$148,082
Interest Rate
6.62%
Mortgage Type
VA
Purchase Details
Closed on
Aug 17, 2001
Sold by
Stringer Lyman W
Bought by
Davis Lynette
Home Financials for this Owner
Home Financials are based on the most recent Mortgage that was taken out on this home.
Original Mortgage
$122,084
Interest Rate
6.97%
Mortgage Type
FHA
Purchase Details
Closed on
Feb 21, 2001
Sold by
Rjg Builders
Bought by
Stringer Lyman W
Home Financials for this Owner
Home Financials are based on the most recent Mortgage that was taken out on this home.
Original Mortgage
$92,000
Interest Rate
7.12%
Mortgage Type
New Conventional
Create a Home Valuation Report for This Property
The Home Valuation Report is an in-depth analysis detailing your home's value as well as a comparison with similar homes in the area
Home Values in the Area
Average Home Value in this Area
Purchase History
| Date | Buyer | Sale Price | Title Company |
|---|---|---|---|
| Progress Atlanta Llc | $235,000 | -- | |
| Beauford Carol A | $145,000 | -- | |
| Davis Lynette | $124,000 | -- | |
| Stringer Lyman W | $102,300 | -- |
Source: Public Records
Mortgage History
| Date | Status | Borrower | Loan Amount |
|---|---|---|---|
| Previous Owner | Beauford Carol A | $148,082 | |
| Previous Owner | Davis Lynette | $122,084 | |
| Previous Owner | Stringer Lyman W | $92,000 |
Source: Public Records
Tax History
| Year | Tax Paid | Tax Assessment Tax Assessment Total Assessment is a certain percentage of the fair market value that is determined by local assessors to be the total taxable value of land and additions on the property. | Land | Improvement |
|---|---|---|---|---|
| 2025 | $4,802 | $120,000 | $11,561 | $108,439 |
| 2024 | $4,802 | $124,200 | $12,000 | $112,200 |
| 2023 | $4,384 | $112,760 | $12,000 | $100,760 |
| 2022 | $3,499 | $89,680 | $10,000 | $79,680 |
| 2021 | $58 | $67,240 | $10,000 | $57,240 |
| 2020 | $58 | $58,320 | $8,000 | $50,320 |
| 2019 | $58 | $54,120 | $8,000 | $46,120 |
| 2018 | $58 | $49,480 | $8,000 | $41,480 |
| 2016 | $58 | $44,920 | $8,000 | $36,920 |
| 2015 | $1,561 | $38,000 | $6,000 | $32,000 |
| 2014 | -- | $33,760 | $6,000 | $27,760 |
Source: Public Records
Map
Nearby Homes
- 125 Augusta Dr
- 305 Worthing Ln
- 216 Montrose Dr
- 248 Montrose Dr
- 315 Montrose Dr
- 0 Tunis Rd Unit 10544344
- 100 Holloway Rd
- 0 Jodeco Rd Unit 10415182
- 0 Jodeco Rd Unit 10544322
- 221 Langshire Dr
- 133 Harold Dr
- 166 Glen Eagle Way
- 431 Winged Foot Dr
- 268 Langshire Dr
- 408 Castle Rock
- 103 Royal Burgess Way
- 110 Glen Eagle Way
- 721 Fieldstream Way
- 103 Glen Eagle Way
- 105 Nanci Ct
- 1209 Redbud Ct
- 1201 Redbud Ct
- 1213 Redbud Ct
- 906 Chase Trail
- 914 Chase Trail
- 922 Chase Trail
- 900 Chase Trail
- 1204 Redbud Ct
- 1200 Redbud Ct
- 1208 Redbud Ct
- 1217 Redbud Ct
- 930 Chase Trail
- 458 Chase Marion Way
- 454 Chase Marion Way
- 1230 Redbud Ct
- 1221 Redbud Ct
- 938 Chase Trail
- 902 Chase Trail
- 466 Chase Marion Way
- 1100 Collyns Ct
Your Personal Tour Guide
Ask me questions while you tour the home.