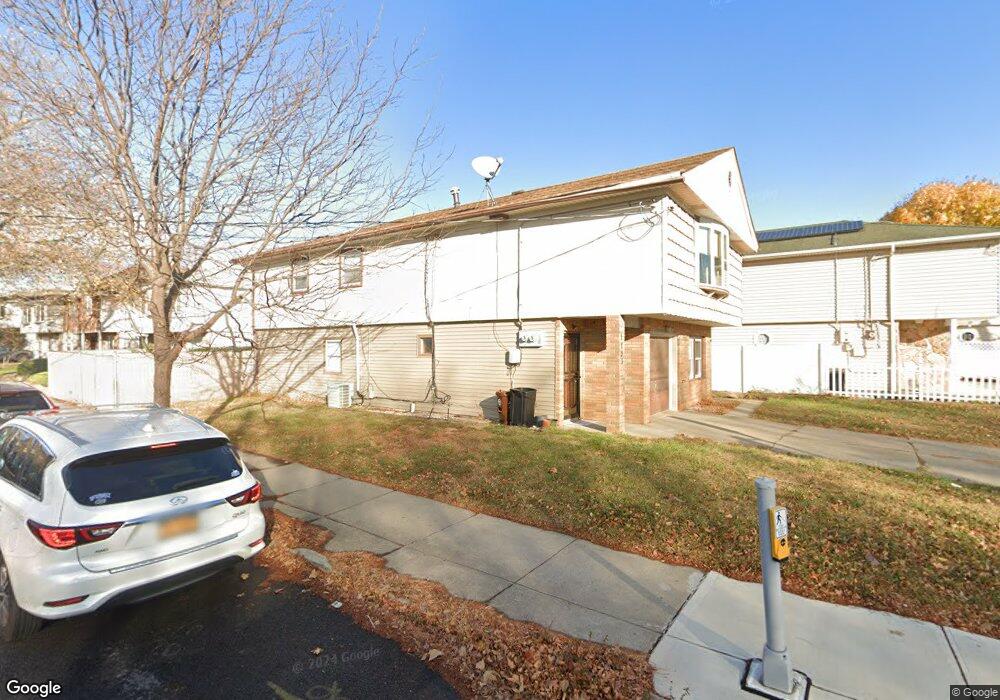
1205 Rockland Ave Staten Island, NY 10314
New Springville NeighborhoodEstimated Value: $850,994 - $962,000
--
Bed
--
Bath
2,322
Sq Ft
$393/Sq Ft
Est. Value
About This Home
This home is located at 1205 Rockland Ave, Staten Island, NY 10314 and is currently estimated at $912,749, approximately $393 per square foot. 1205 Rockland Ave is a home located in Richmond County with nearby schools including P.S. 69 - Daniel D. Tompkins, Is 72 Rocco Laurie, and Port Richmond High School.
Ownership History
Date
Name
Owned For
Owner Type
Purchase Details
Closed on
Dec 7, 2018
Sold by
Palmieri Derek and Palmieri Frank
Bought by
Lee Hing Man and Zhao Ken
Current Estimated Value
Home Financials for this Owner
Home Financials are based on the most recent Mortgage that was taken out on this home.
Original Mortgage
$513,750
Outstanding Balance
$453,528
Interest Rate
4.9%
Mortgage Type
New Conventional
Estimated Equity
$459,221
Purchase Details
Closed on
Mar 30, 2018
Sold by
Ttee Marissa Palmieri Rios
Bought by
Palmieri Derek
Purchase Details
Closed on
Oct 22, 2016
Sold by
Palmieri Catherine
Bought by
Irrevocable Rios Marissa Palmieri and Catherine Palmieri Irrevocable Trust
Purchase Details
Closed on
Nov 17, 2006
Sold by
Palmieri Catherine
Bought by
Palmieri Catherine and Catherine Palmieri Living Trust
Create a Home Valuation Report for This Property
The Home Valuation Report is an in-depth analysis detailing your home's value as well as a comparison with similar homes in the area
Home Values in the Area
Average Home Value in this Area
Purchase History
| Date | Buyer | Sale Price | Title Company |
|---|---|---|---|
| Lee Hing Man | $685,000 | None Available | |
| Palmieri Derek | -- | None Available | |
| Irrevocable Rios Marissa Palmieri | -- | None Available | |
| Palmieri Catherine | -- | None Available |
Source: Public Records
Mortgage History
| Date | Status | Borrower | Loan Amount |
|---|---|---|---|
| Open | Lee Hing Man | $513,750 |
Source: Public Records
Tax History Compared to Growth
Tax History
| Year | Tax Paid | Tax Assessment Tax Assessment Total Assessment is a certain percentage of the fair market value that is determined by local assessors to be the total taxable value of land and additions on the property. | Land | Improvement |
|---|---|---|---|---|
| 2025 | $8,737 | $56,640 | $9,965 | $46,675 |
| 2024 | $8,737 | $52,860 | $10,073 | $42,787 |
| 2023 | $8,335 | $41,040 | $8,813 | $32,227 |
| 2022 | $8,193 | $51,780 | $12,240 | $39,540 |
| 2021 | $8,572 | $45,360 | $12,240 | $33,120 |
| 2020 | $8,147 | $46,080 | $12,240 | $33,840 |
| 2019 | $7,597 | $45,300 | $12,240 | $33,060 |
| 2017 | $6,972 | $34,200 | $10,652 | $23,548 |
| 2016 | $6,786 | $33,943 | $11,918 | $22,025 |
| 2015 | $5,798 | $32,022 | $9,305 | $22,717 |
| 2014 | $5,798 | $30,210 | $9,546 | $20,664 |
Source: Public Records
Map
Nearby Homes
- 47 Grissom Ave
- 16 Shepard Ave
- 100 Carpenter Ave
- 8 Carpenter Ave
- 15 Gadsen Place Unit 2A
- 14 Grissom Ave Unit 22
- 12 Grissom Ave Unit 23
- 11 Cooper Terrace Unit 51
- 17 Gadsen Place Unit 1F
- 19 Gadsen Place Unit 2G
- 21 Gadsen Place Unit 1B
- 17 Gadsen Place Unit 1H
- 1294 Rockland Ave Unit 1D
- 29A Cooper Terrace Unit 46
- 1304 Rockland Ave
- 17 Orbit Ln
- 49 Gadsen Place
- 1317 Rockland Ave
- 127 Keating Place
- 34 Orbit Ln
- 1205 Rockland Ave Unit 1
- 1205 Rockland Ave Unit 2
- 1203 Rockland Ave
- 55 Shepard Ave
- 1201 Rockland Ave
- 51 Shepard Ave
- 1221 Rockland Ave
- 3 Ferndale Ave
- 1199 Rockland Ave
- 47 Shepard Ave
- 60 Carpenter Ave
- 1225 Rockland Ave
- 5 Ferndale Ave
- 1197C Rockland Ave
- 7 Ferndale Ave
- 56 Carpenter Ave
- 48 Shepard Ave
- 43 Shepard Ave
- 9 Ferndale Ave
- 1197B Rockland Ave