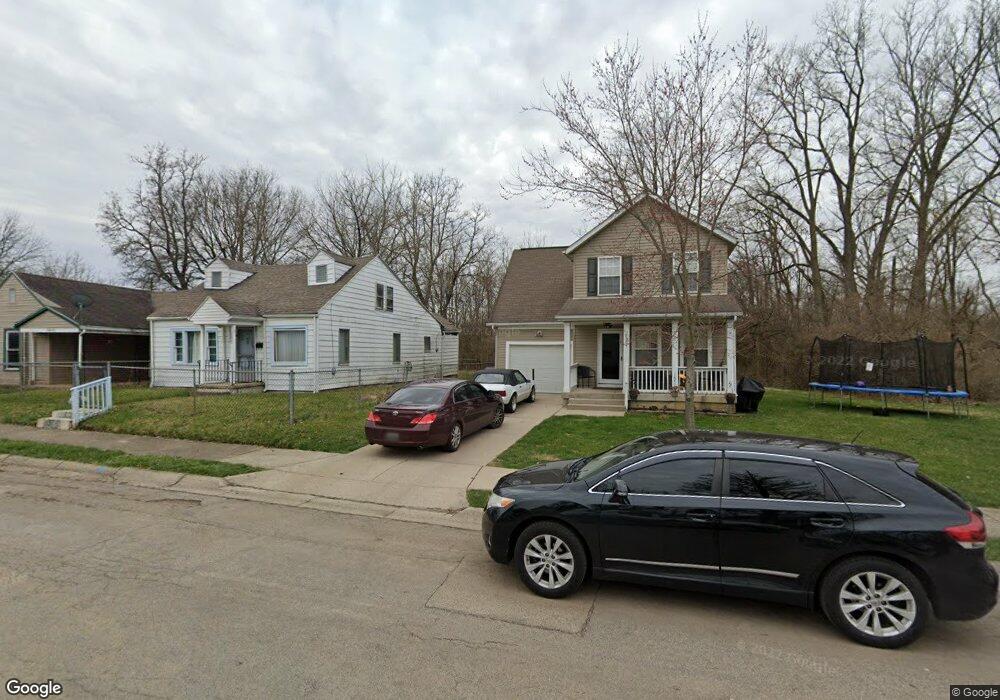
1205 S Bell Ave Springfield, OH 45506
Estimated Value: $131,000 - $139,000
4
Beds
2
Baths
1,296
Sq Ft
$105/Sq Ft
Est. Value
About This Home
This home is located at 1205 S Bell Ave, Springfield, OH 45506 and is currently estimated at $135,821, approximately $104 per square foot. 1205 S Bell Ave is a home located in Clark County with nearby schools including Fulton Elementary School, Hayward Middle School, and Springfield High School.
Ownership History
Date
Name
Owned For
Owner Type
Purchase Details
Closed on
Jun 20, 2025
Sold by
Springfield Homes Lp
Bought by
Mcgee Alise
Current Estimated Value
Home Financials for this Owner
Home Financials are based on the most recent Mortgage that was taken out on this home.
Original Mortgage
$101,100
Outstanding Balance
$100,804
Interest Rate
6.13%
Mortgage Type
New Conventional
Estimated Equity
$35,017
Purchase Details
Closed on
Feb 15, 2001
Sold by
Truss Wallace Orlando
Bought by
Springfield Homes Lp
Purchase Details
Closed on
Feb 8, 2001
Sold by
Westery Cassandra and Westery Sylvester
Bought by
Springfield Homes Lp
Purchase Details
Closed on
Jan 27, 2001
Sold by
Charles Marlita and Charles Allan H
Bought by
Springfield Homes Lp
Purchase Details
Closed on
Oct 5, 2000
Sold by
Jackson Kent L
Bought by
Springfield Homes Lp
Create a Home Valuation Report for This Property
The Home Valuation Report is an in-depth analysis detailing your home's value as well as a comparison with similar homes in the area
Home Values in the Area
Average Home Value in this Area
Purchase History
| Date | Buyer | Sale Price | Title Company |
|---|---|---|---|
| Mcgee Alise | $134,000 | M & M Title | |
| Springfield Homes Lp | -- | -- | |
| Springfield Homes Lp | -- | -- | |
| Springfield Homes Lp | -- | -- | |
| Springfield Homes Lp | $4,000 | -- |
Source: Public Records
Mortgage History
| Date | Status | Borrower | Loan Amount |
|---|---|---|---|
| Open | Mcgee Alise | $101,100 |
Source: Public Records
Tax History Compared to Growth
Tax History
| Year | Tax Paid | Tax Assessment Tax Assessment Total Assessment is a certain percentage of the fair market value that is determined by local assessors to be the total taxable value of land and additions on the property. | Land | Improvement |
|---|---|---|---|---|
| 2024 | $1,456 | $29,470 | $1,870 | $27,600 |
| 2023 | $1,456 | $29,470 | $1,870 | $27,600 |
| 2022 | $1,491 | $29,470 | $1,870 | $27,600 |
| 2021 | $1,446 | $26,320 | $1,670 | $24,650 |
| 2020 | $1,450 | $26,320 | $1,670 | $24,650 |
| 2019 | $1,453 | $26,320 | $1,670 | $24,650 |
| 2018 | $1,528 | $26,560 | $1,670 | $24,890 |
| 2017 | $1,527 | $26,559 | $1,670 | $24,889 |
| 2016 | $1,529 | $26,559 | $1,670 | $24,889 |
| 2015 | $1,559 | $26,559 | $1,670 | $24,889 |
| 2014 | $1,552 | $26,559 | $1,670 | $24,889 |
| 2013 | $1,536 | $26,559 | $1,670 | $24,889 |
Source: Public Records
Map
Nearby Homes
- 929 S Western Ave
- 1216 Innisfallen Ave
- 924 W State St
- 1201 Dibert Ave
- 1010 Heard Ave
- 830 Dibert Ave
- 1109 Montgomery Ave
- 642 W Euclid Ave
- 1515 W Perrin Ave
- 0 Montgomery Ave
- 506 W Southern Ave
- 424 W State St
- 416 W Southern Ave
- 409 W Southern Ave
- 427 Rosewood Ave
- 1220 W Pleasant St
- 2002 Scioto St
- 833 W Mulberry St
- 326 W Grand Ave
- 711 W Mulberry St
- 1207 S Bell Ave
- 1215 S Bell Ave
- 1204 Eden Ave
- 1204 S Bell Ave
- 1170 S Bell Ave
- 1208 S Bell Ave
- 1166 S Bell Ave
- 1210 S Bell Ave
- 1162 S Bell Ave
- 1026 W Johnny Lytle Ave
- 1026 W Johnny Lytle Ave
- 1252 Eden Ave
- 1152 S Bell Ave
- 1117 S Bell Ave
- 1025 W Johnny Lytle Ave
- 1205 Eden Ave
- 1203 Eden Ave
- 1019 W Johnny Lytle Ave
- 1163 S Western Ave
- 1215 S Western Ave